# Libraries
library(cmprsk)
library(survminer)
library(ggplot2)
# Data used
set.seed(2)
df <- data.frame(del=rexp(100)*5, event=sample(0:2,100,replace=TRUE), groupe=sample(c("A", "B"),100,replace=TRUE))
df$event_surv <- ifelse(df$event==0, 0, 1)#Surv object
fit <- cuminc(df$del, df$event)
fit_surv <- survfit(Surv(del, event_surv)~1, data=df)# We set the break time by for having the same in ggcompetingrisks1 function and ggrisktable function
break.time.by <- 6
#Display basic curves
plot.icc=ggcompetingrisks(
fit, # survfit object with calculated statistics.
break.time.by = break.time.by, # break X axis in time intervals by 200.
multiple_panels = FALSE,
xlab = "Time (months)", ylab="Cumulative incidence",
xlim=c(0, 24), ylim=c(0, 1),
title="", legend="top",
conf.int = F,
lwd=1,
ggtheme = theme_classic(), # customize plot and risk table with a theme.
) + scale_x_continuous(breaks = seq(0, 50, 6))
num.icc <- ggrisktable(
fit_surv, # survfit object with calculated statistics.
data=df,
break.time.by = break.time.by, # break X axis in time intervals by 200.
y.text = FALSE, # show bars instead of names in text annotations
fontsize=3,
tables.theme = theme_cleantable())
ggarrange(plot.icc, num.icc, ncol = 1, nrow = 2, heights = c(0.85, 0.15), align = "v")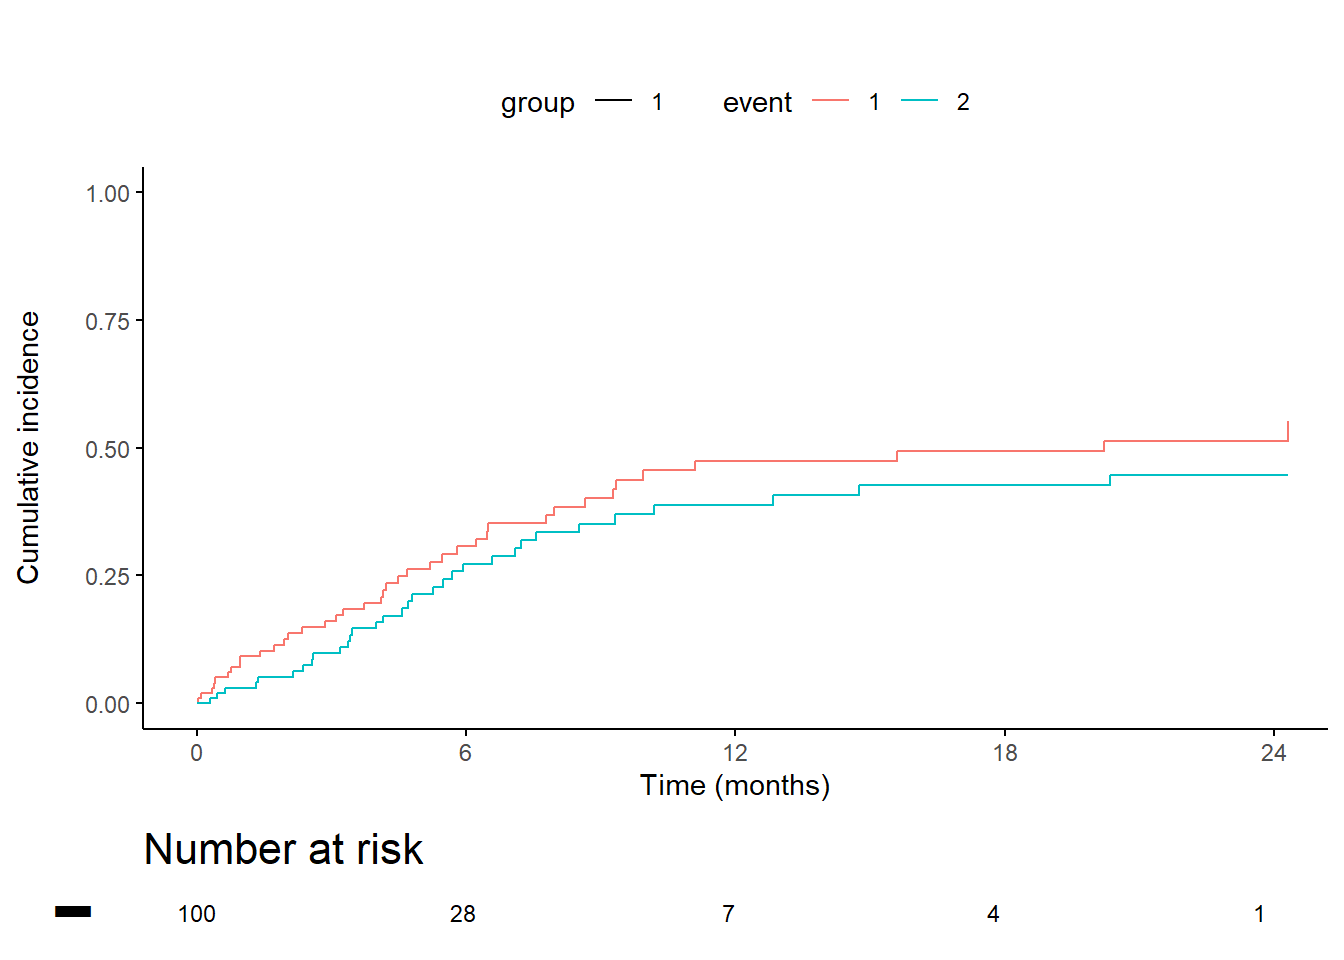
Contact
This document is a work by Emma Lafaurie (emma.lafaurie@inserm.fr) for the SBIM (Service de Biostatistique et Information Médicale) at Saint-Louis Hospital in Paris.
Based on the template of Yan Holtz.