To add information to the swimmer plot we can use the swimmer arrows function.
We will here use both swimmer_plot and swimmer_arrows() functions and the dataset created in the Data & Function page.
# Libraries
library(ggplot2)
library(swimplot)swimmer_plot(df=swimdata,id='SUBJID',end='survie',
name_fill='Bestrep',
width=.85)+
xlab("ID")+
ylab("Time (in days)")+
swimmer_points(df_points=swimdata,id="SUBJID",time="survie", name_shape="Death", size=2)+
swimmer_arrows(df_arrows=swimdata,id='SUBJID',arrow_start='delpfs',
cont = 'delpfs',name_col='Prog',cex=1, type = "open" ) +
scale_color_manual(name="Prog",values=c("yes"="black", "NA"="grey")) 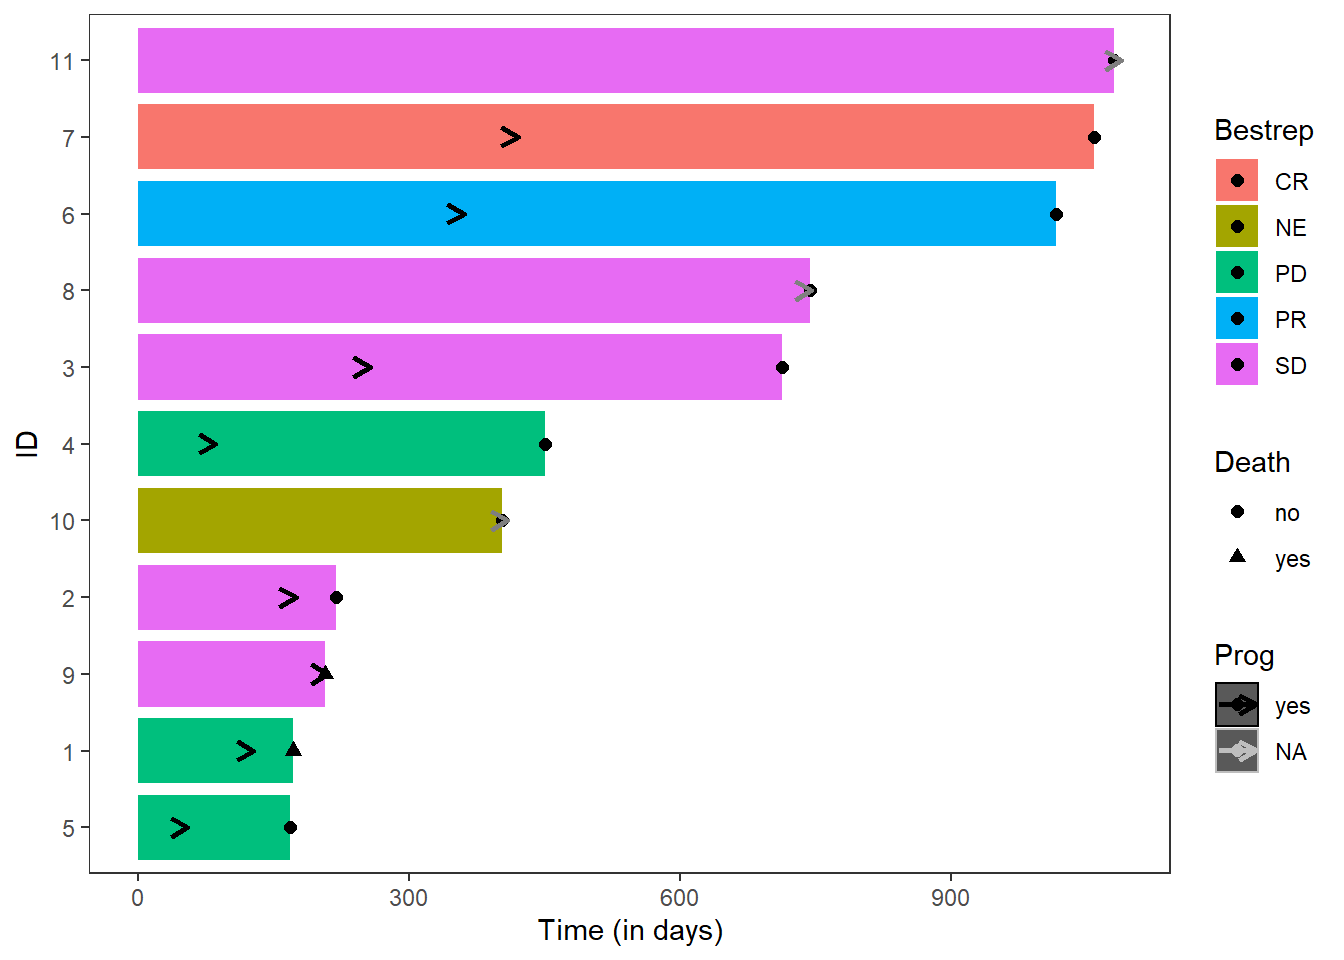
Contact
This document is a work by Emma Lafaurie (emma.lafaurie@inserm.fr) for the SBIM (Service de Biostatistique et Information Médicale) at Saint-Louis Hospital in Paris.
Based on the template of Yan Holtz.