Basic barplot with geom_bar()
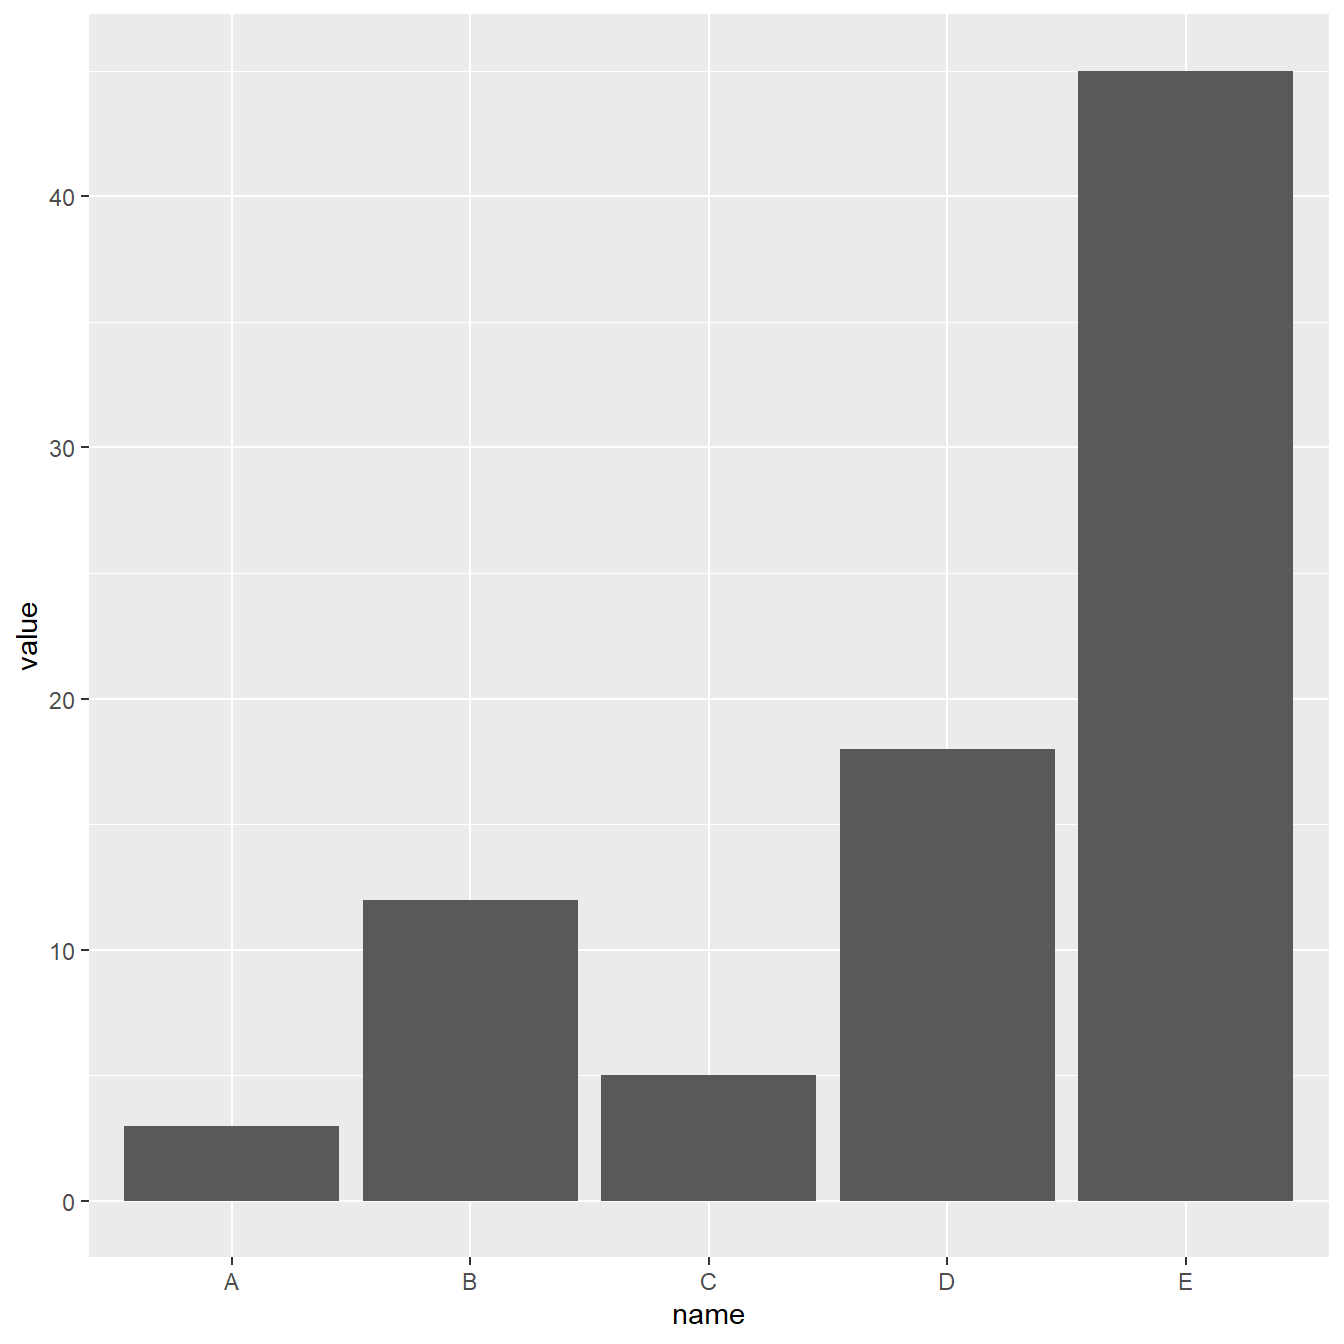
This is the most basic barplot you can build using the ggplot2 package. It follows those steps:
- always start by calling the
ggplot()function. - then specify the
dataobject. It has to be a data frame. - then come thes aesthetics, set in the
aes()function: set the categoric variable for the X axis, use the numeric for the Y axis - finally call
geom_bar(). You have to specifystat="identity"for this kind of dataset.
# Load ggplot2
library(ggplot2)

# Create data
data <- data.frame(
  name=c("A","B","C","D","E") ,
  value=c(3,12,5,18,45)
  )

# Barplot
ggplot(data, aes(x=name, y=value)) +
  geom_bar(stat = "identity")
Control bar color
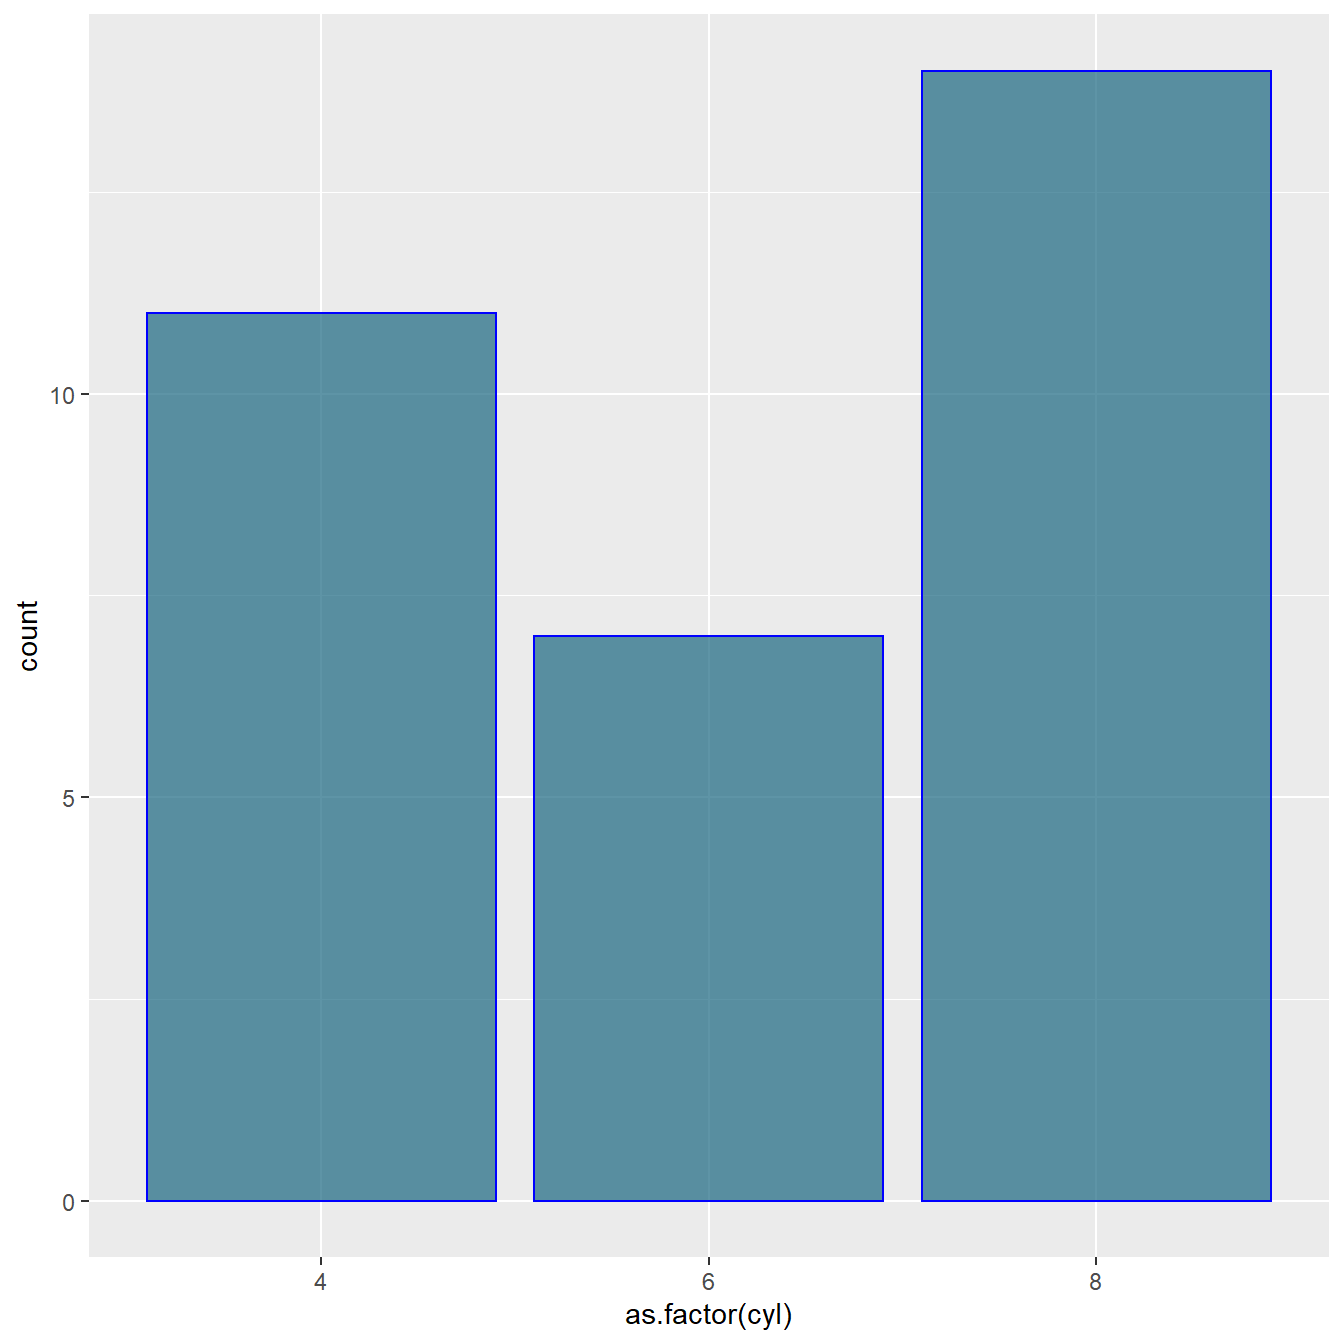
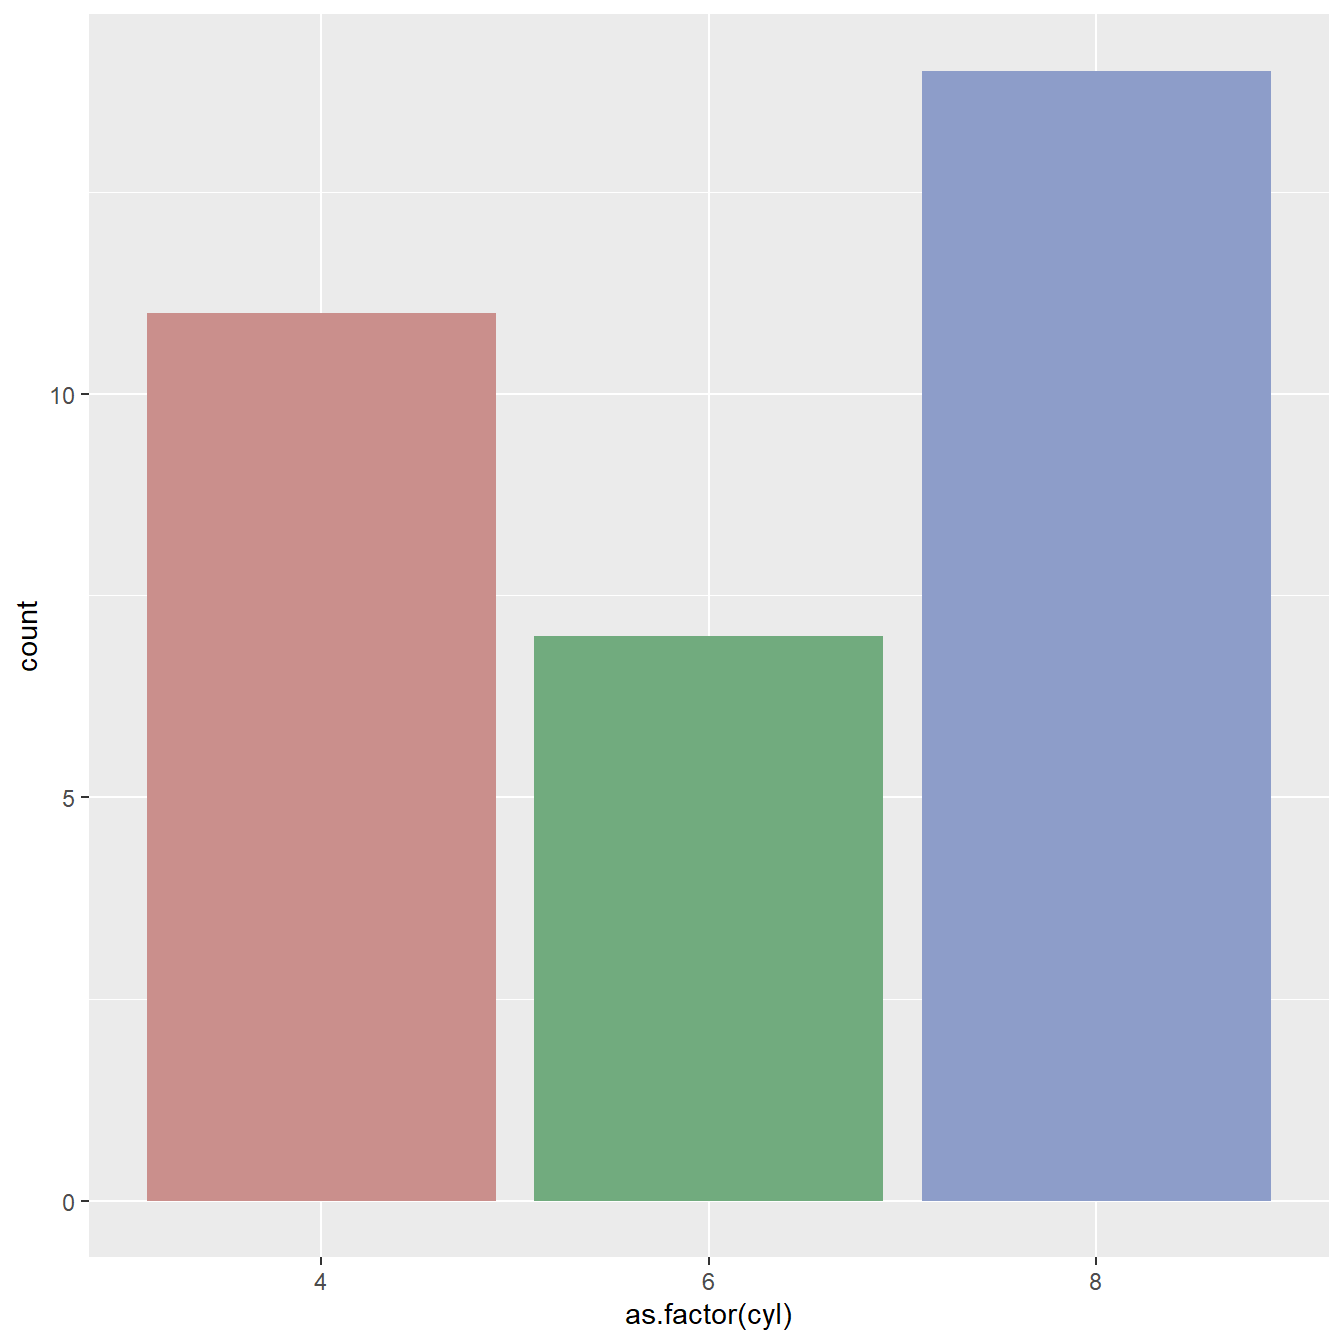
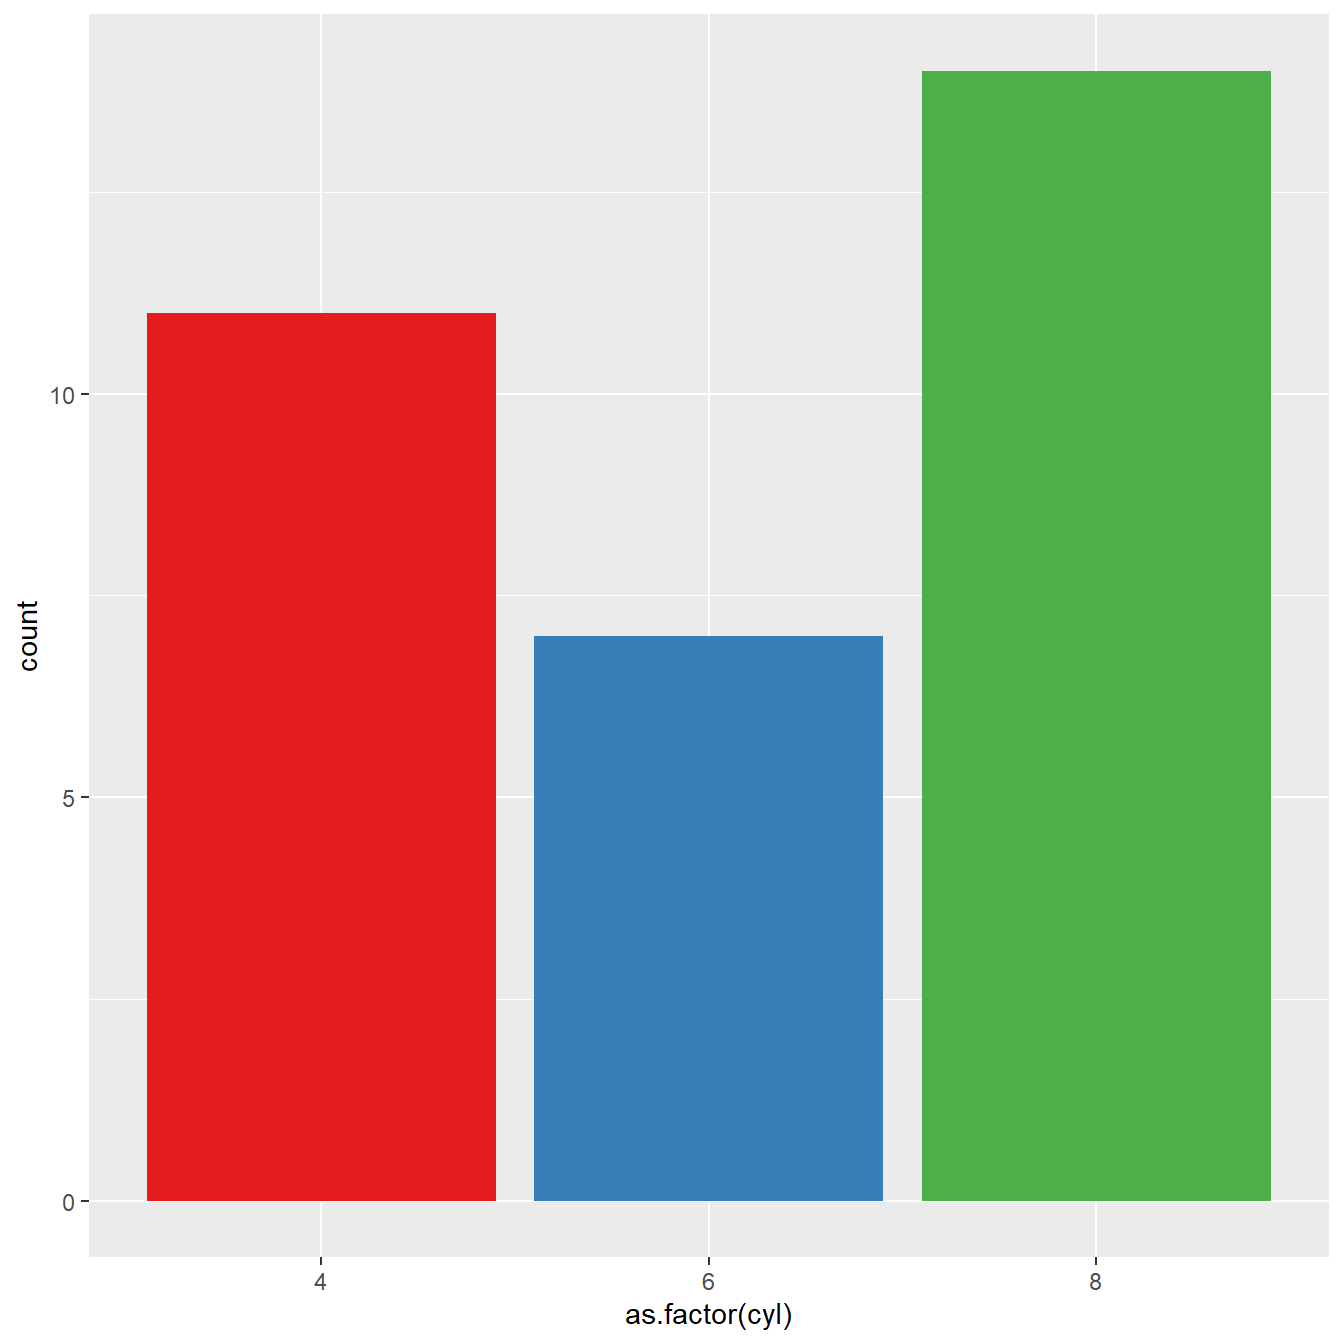
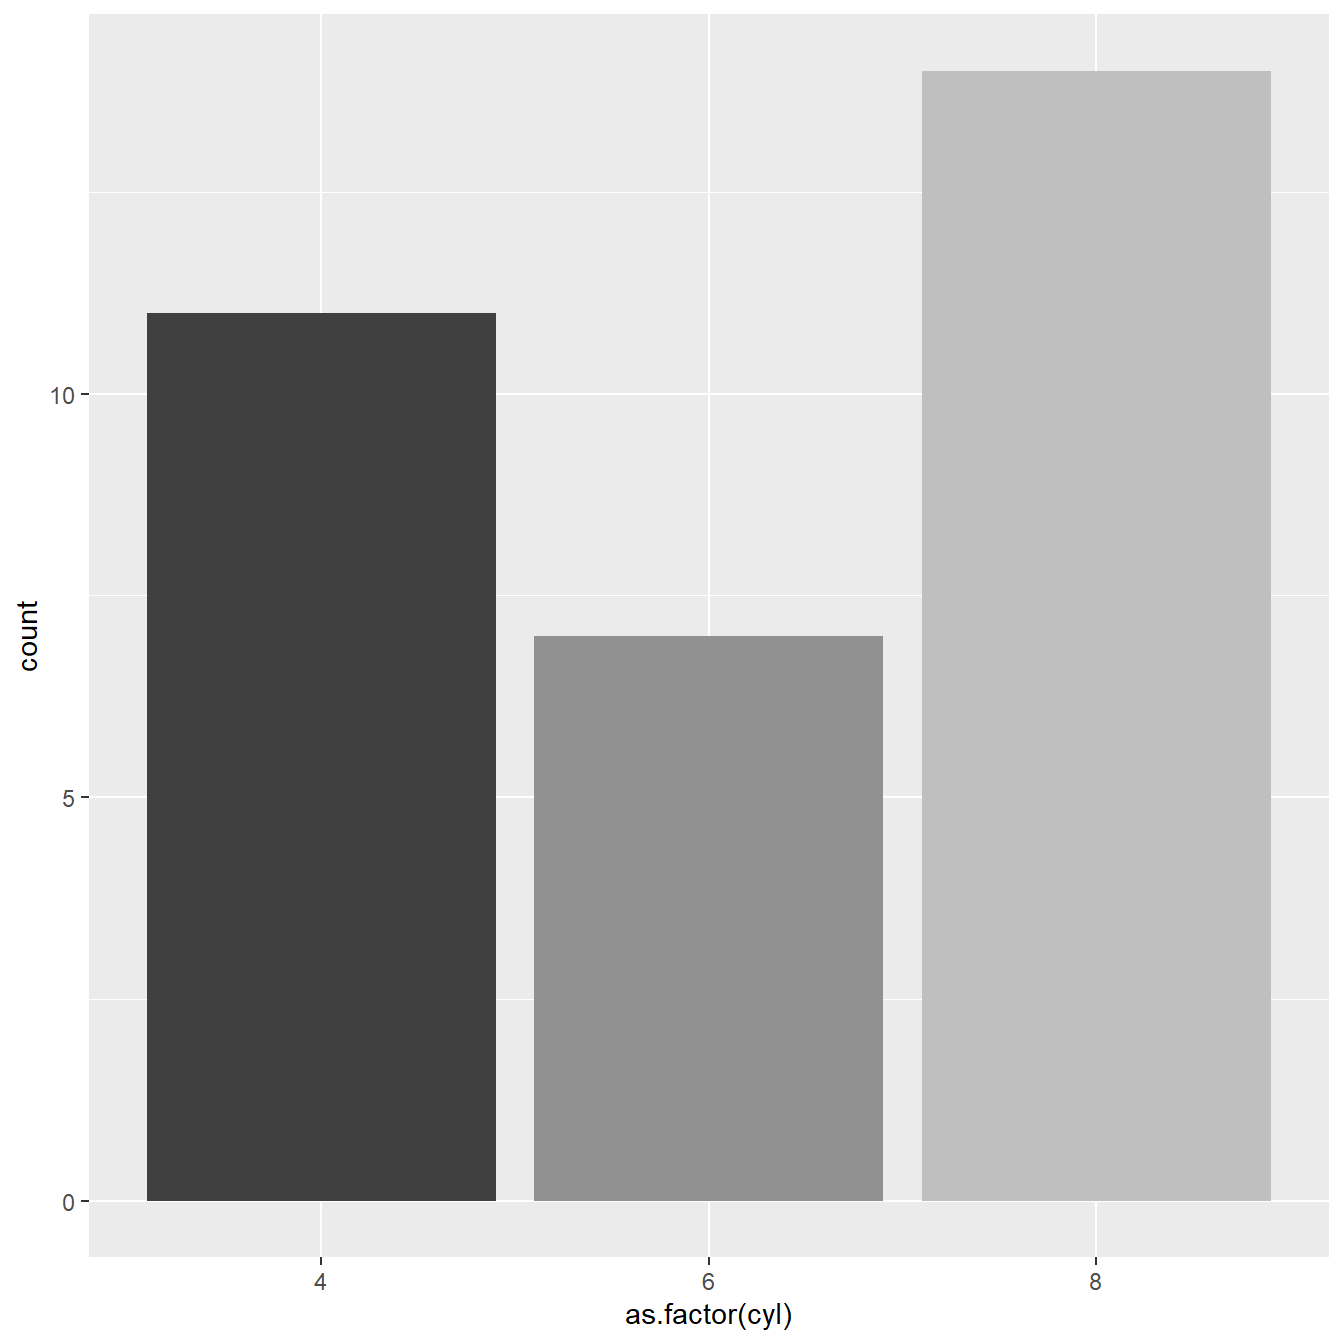
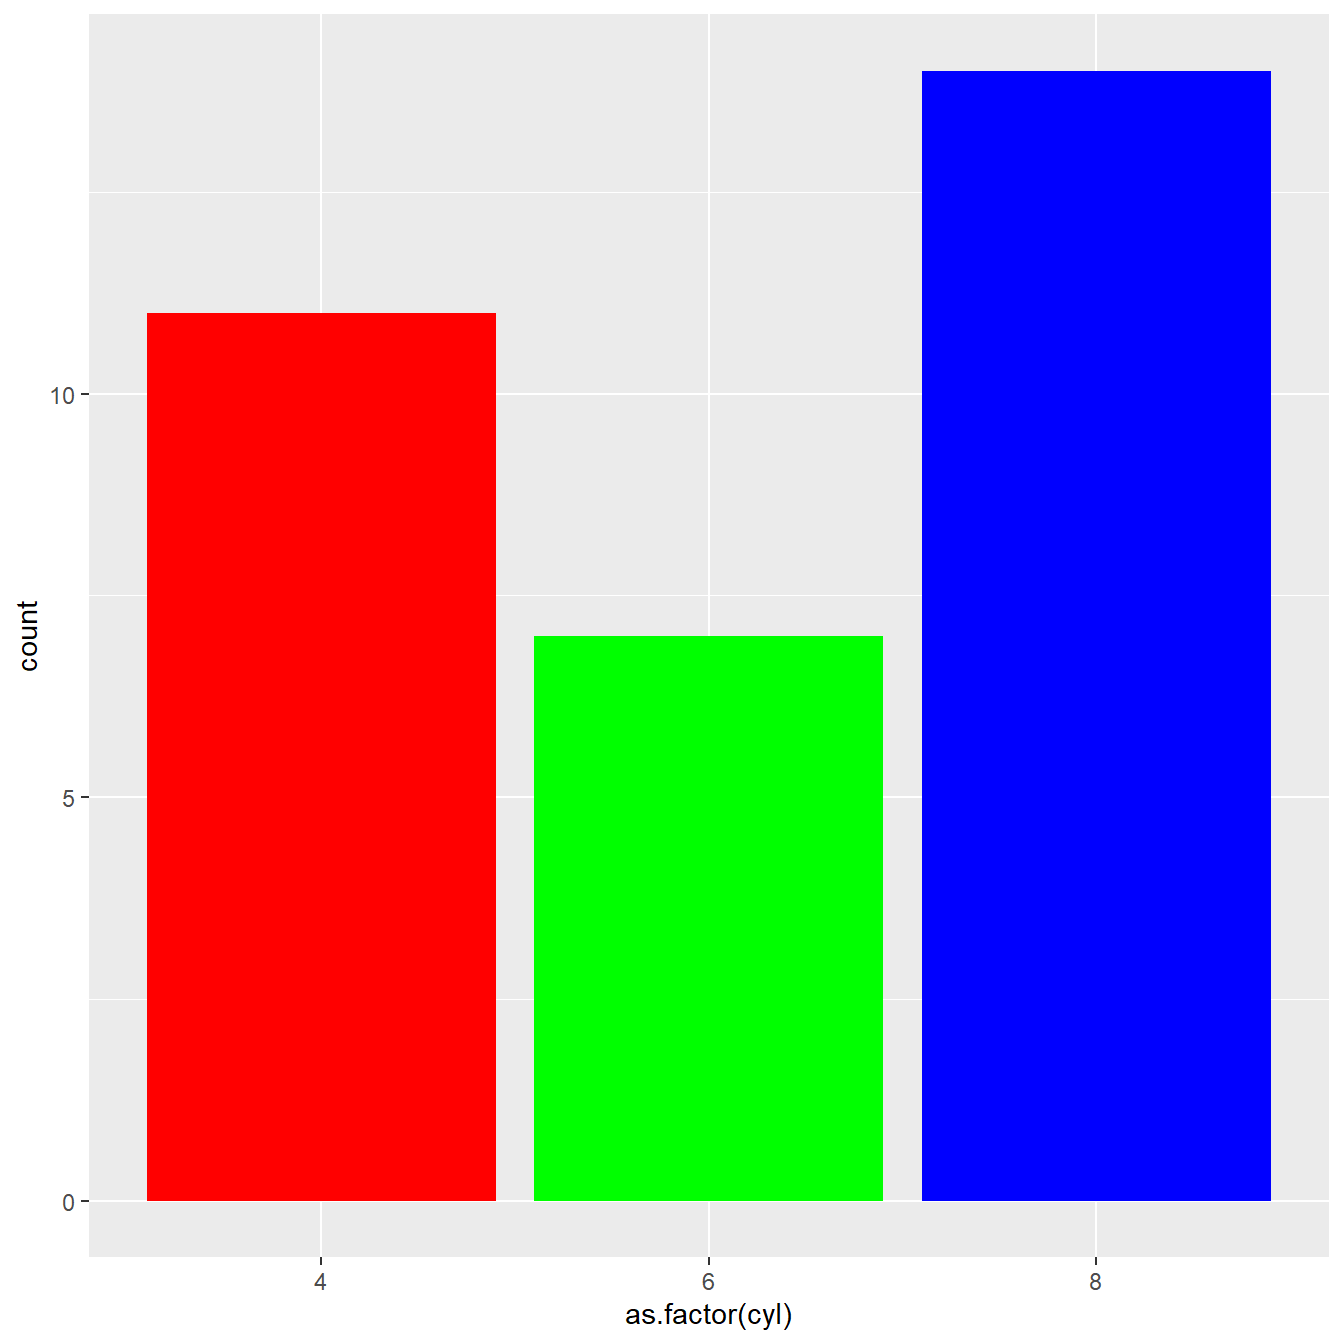
Here are a few different methods to control bar colors. Note that using a legend in this case is not necessary since names are already displayed on the X axis. You can remove it with theme(legend.position="none").
# Libraries
library(ggplot2)

# 1: uniform color. Color is for the border, fill is for the inside
ggplot(mtcars, aes(x=as.factor(cyl) )) +
  geom_bar(color="blue", fill=rgb(0.1,0.4,0.5,0.7) )

# 2: Using Hue
ggplot(mtcars, aes(x=as.factor(cyl), fill=as.factor(cyl) )) +
  geom_bar( ) +
  scale_fill_hue(c = 40) +
  theme(legend.position="none")

# 3: Using RColorBrewer
ggplot(mtcars, aes(x=as.factor(cyl), fill=as.factor(cyl) )) +
  geom_bar( ) +
  scale_fill_brewer(palette = "Set1") +
  theme(legend.position="none")


# 4: Using greyscale:
ggplot(mtcars, aes(x=as.factor(cyl), fill=as.factor(cyl) )) +
  geom_bar( ) +
  scale_fill_grey(start = 0.25, end = 0.75) +
  theme(legend.position="none")


# 5: Set manualy
ggplot(mtcars, aes(x=as.factor(cyl), fill=as.factor(cyl) )) +
  geom_bar( ) +
  scale_fill_manual(values = c("red", "green", "blue") ) +
  theme(legend.position="none")
Horizontal barplot with coord_flip()
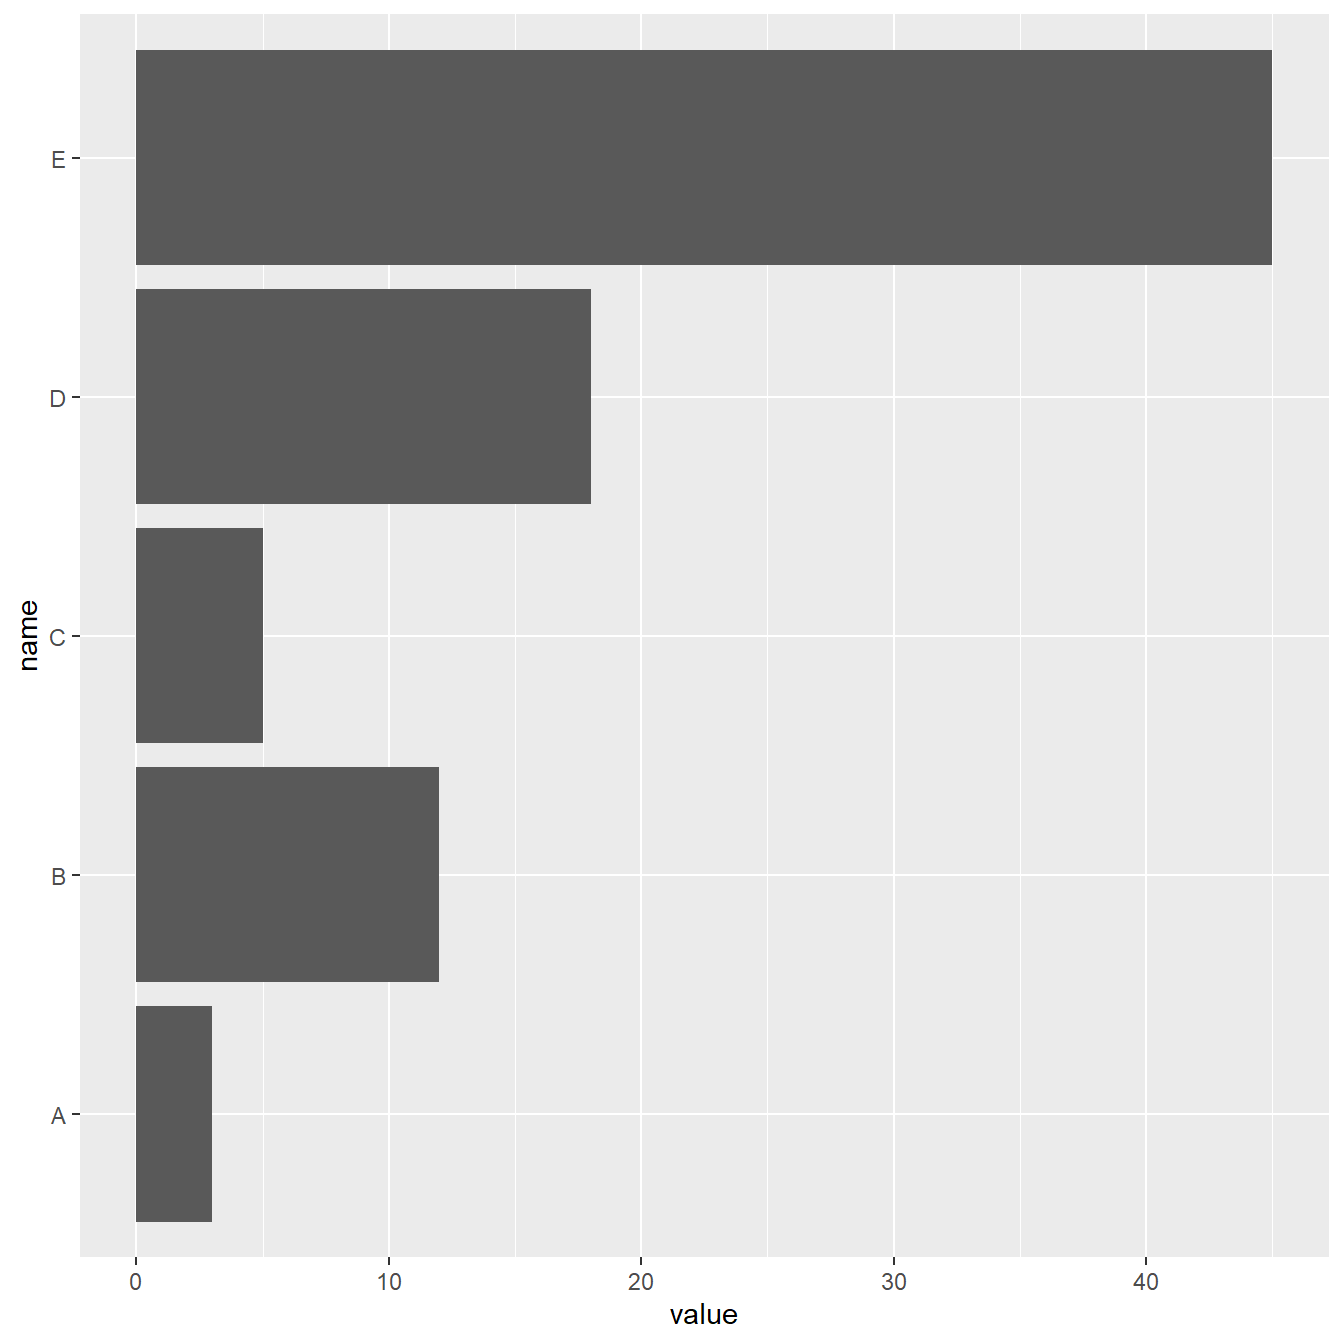
It often makes sense to turn your barplot horizontal. Indeed, it makes the group labels much easier to read.
Fortunately, the coord_flip() function makes it a breeze.
# Load ggplot2
library(ggplot2)

# Create data
data <- data.frame(
  name=c("A","B","C","D","E") ,
  value=c(3,12,5,18,45)
  )

# Barplot
ggplot(data, aes(x=name, y=value)) +
  geom_bar(stat = "identity") +
  coord_flip()
Control bar width with width
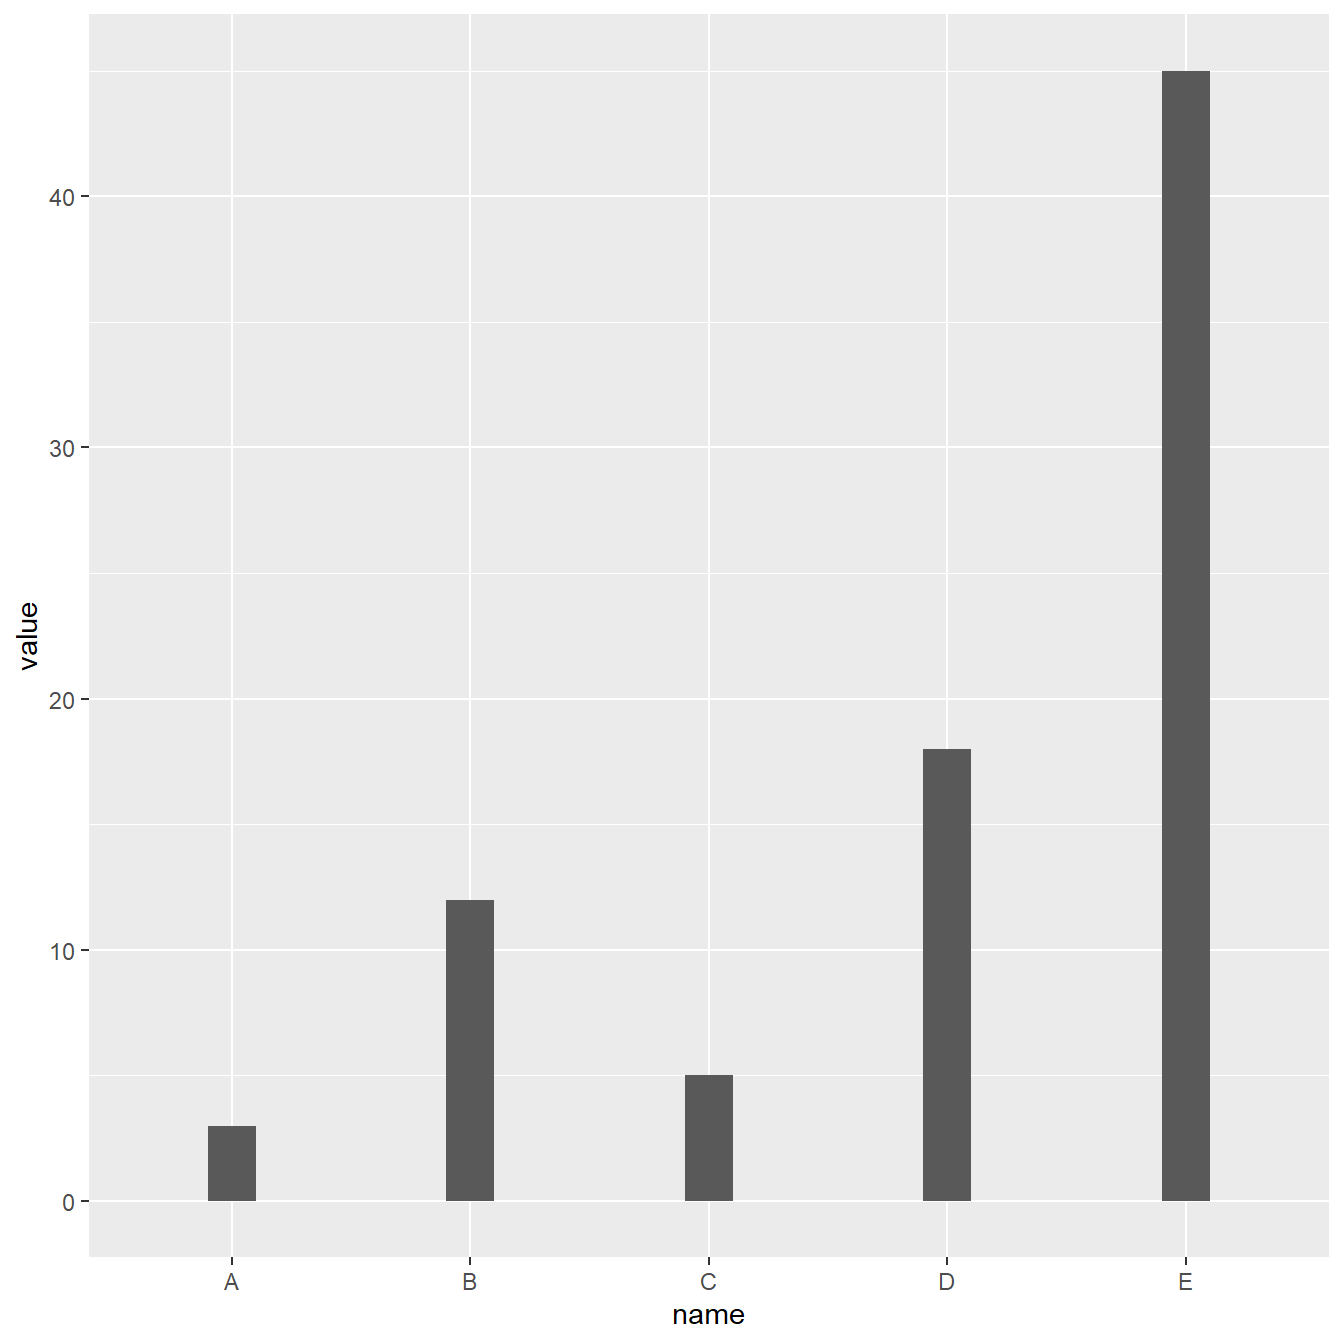
The width argument of the geom_bar() function allows to control the bar width. It ranges between 0 and 1, 1 being full width.
# Load ggplot2
library(ggplot2)

# Create data
data <- data.frame(
  name=c("A","B","C","D","E") ,
  value=c(3,12,5,18,45)
  )

# Barplot
ggplot(data, aes(x=name, y=value)) +
  geom_bar(stat = "identity", width=0.2)