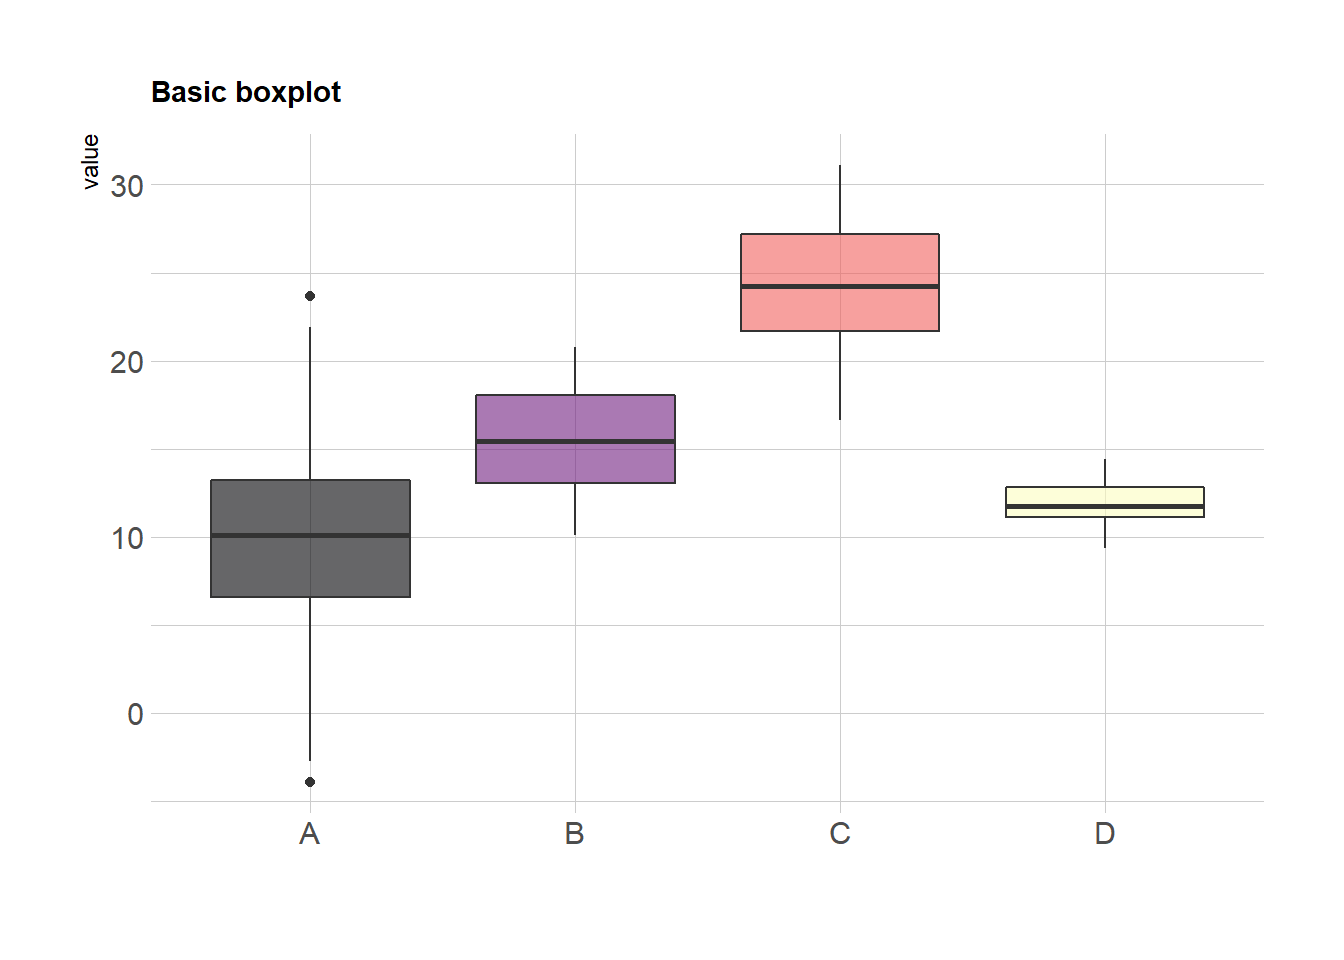
The ggplot2 library allows to make a boxplot using geom_boxplot(). You have to specify a quantitative variable for the Y axis, and a qualitative variable for the X axis.
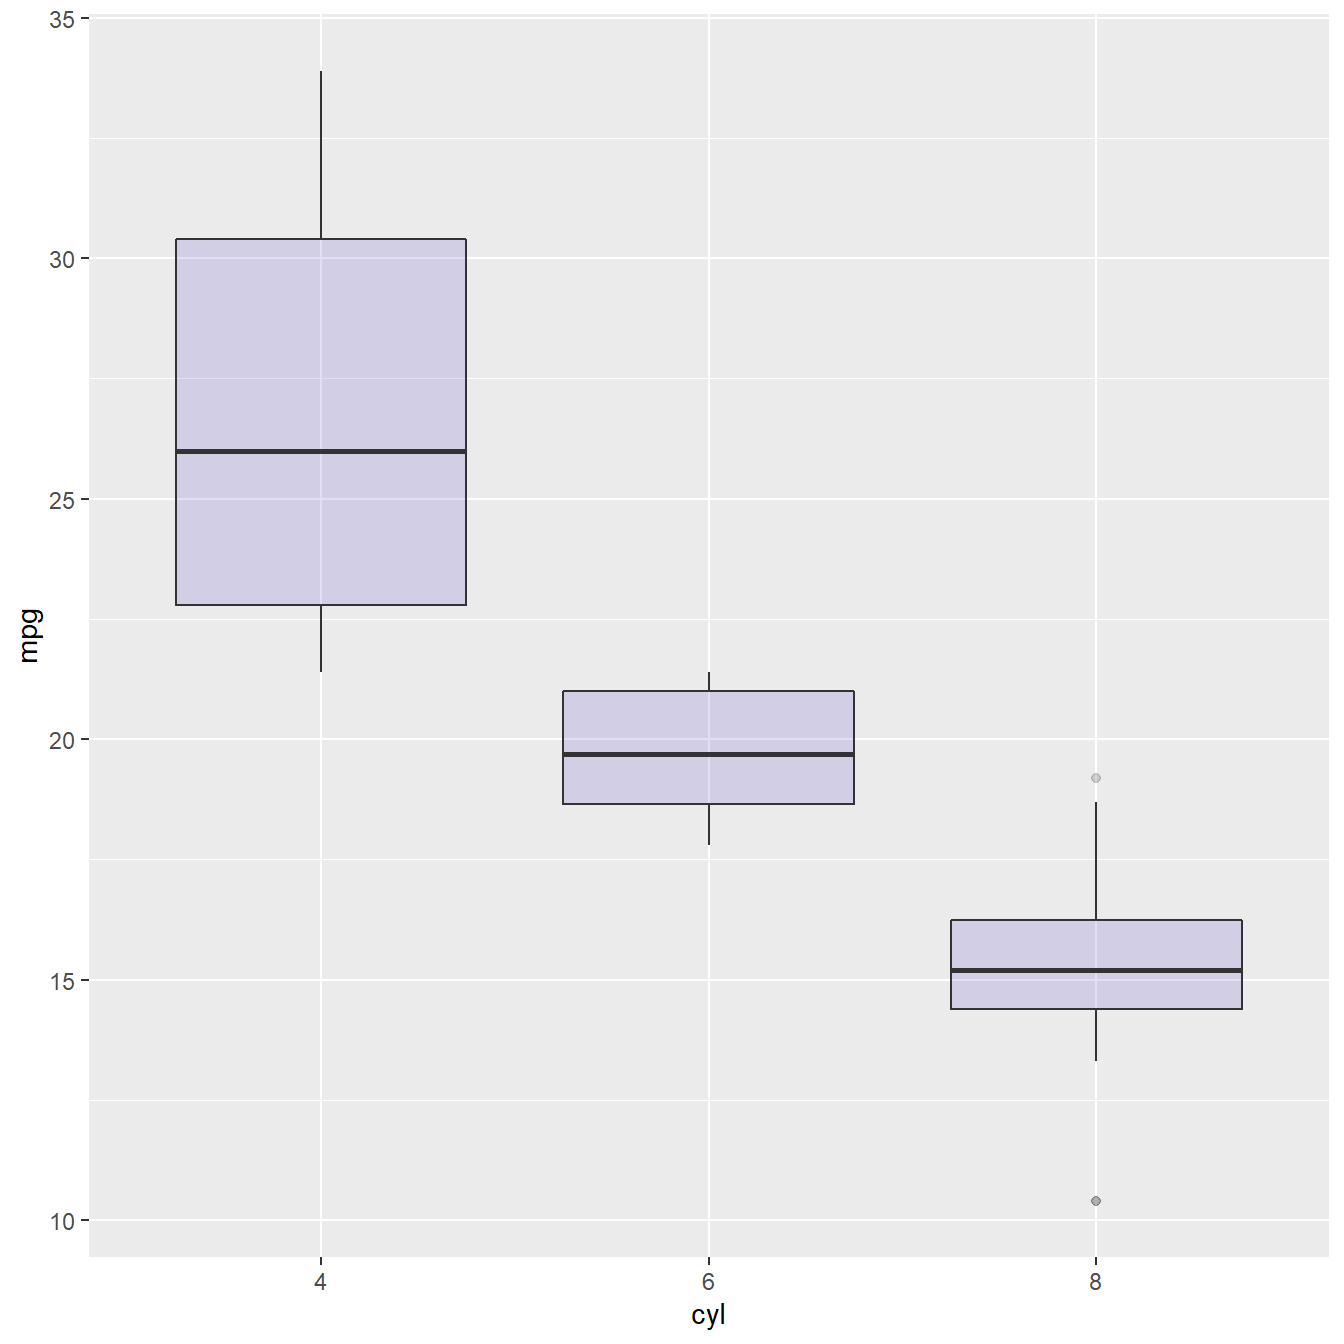
# Load ggplot2
library(ggplot2)

# The mtcars dataset is natively available
# head(mtcars)

# A really basic boxplot
ggplot(mtcars, aes(x=as.factor(cyl), y=mpg)) +
    geom_boxplot(fill="slateblue", alpha=0.2) +
xlab("cyl")library(viridis)
library(ggplot2)
library(hrbrthemes)
library(tidyverse)
# Create dataset
data <- data.frame(
name=c( rep("A",500), rep("B",500), rep("B",500), rep("C",20), rep('D', 100) ),
value=c( rnorm(500, 10, 5), rnorm(500, 13, 1), rnorm(500, 18, 1), rnorm(20, 25, 4), rnorm(100, 12, 1) )
)
# Basic boxplot
data %>%
ggplot( aes(x=name, y=value, fill=name)) +
geom_boxplot() +
scale_fill_viridis(discrete = TRUE, alpha=0.6, option="A") +
theme_ipsum() +
theme(
legend.position="none",
plot.title = element_text(size=11)
) +
ggtitle("Basic boxplot") +
xlab("")