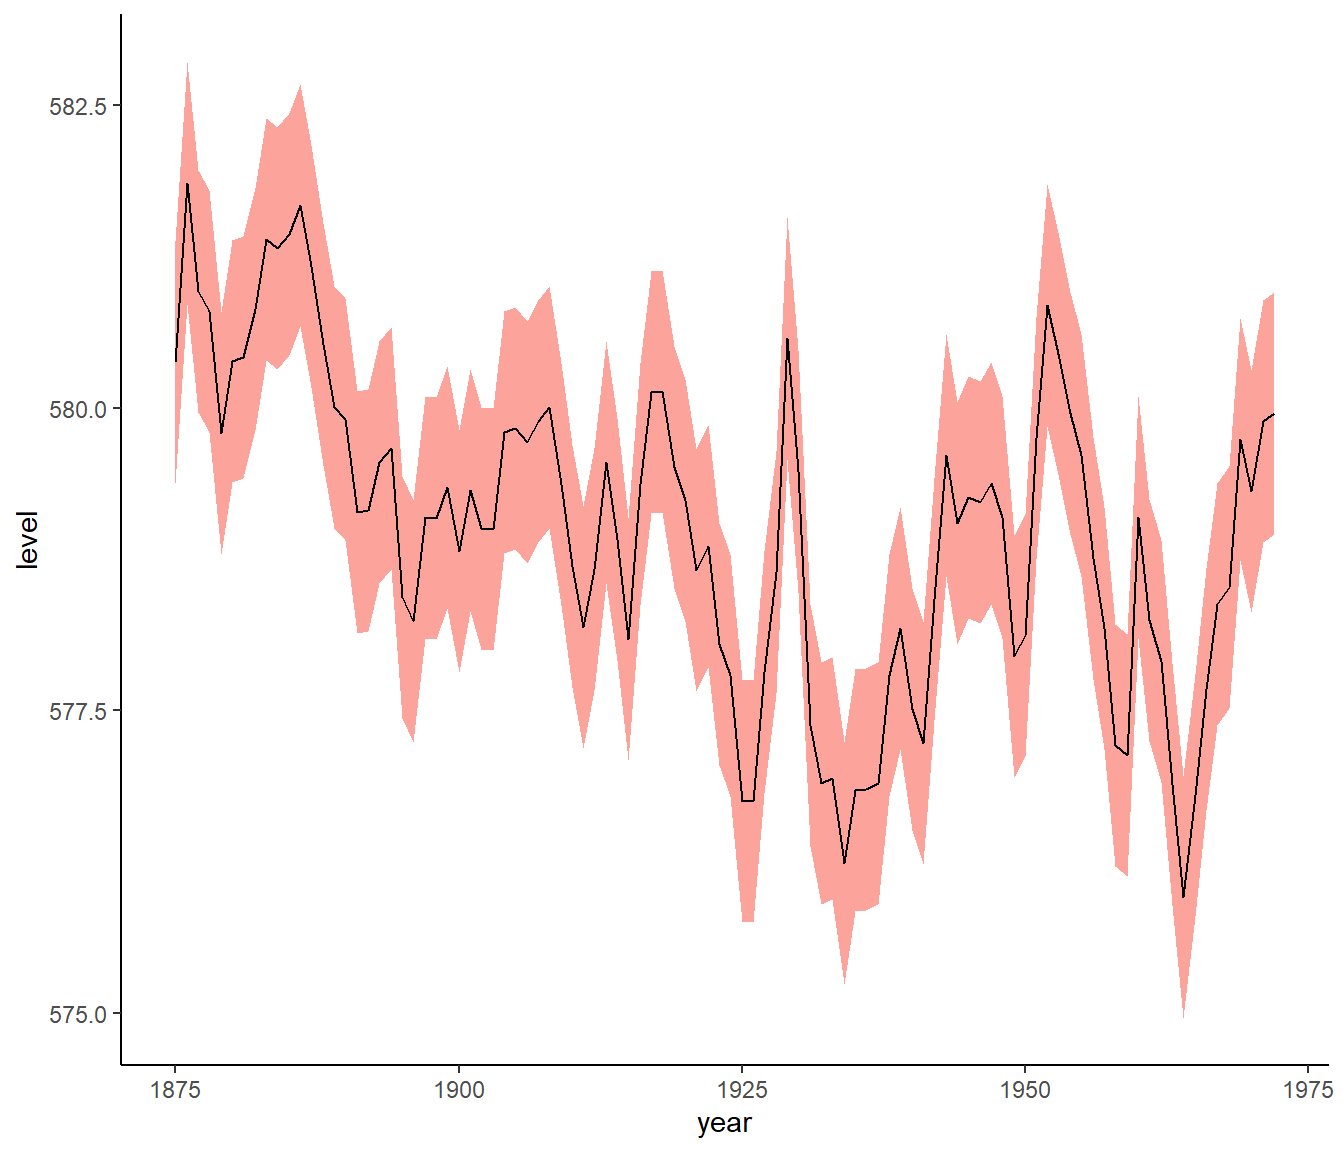
Basic line chart with ggplot2 and geom_line()
Note that geom_ribbon is used since upper and lower values of the envelop are available in the input data. As an alternative, the geom_smooth function autamatically draw an error envelop using different statistical models.
# Library
library(ggplot2)

huron <- data.frame(year = 1875:1972, level = as.vector(LakeHuron))
h <- ggplot(huron, aes(year))

h +
  theme_classic() +
  geom_ribbon(aes(ymin = level - 1, ymax = level + 1), fill = "#fca39c") +
  geom_line(aes(y = level))