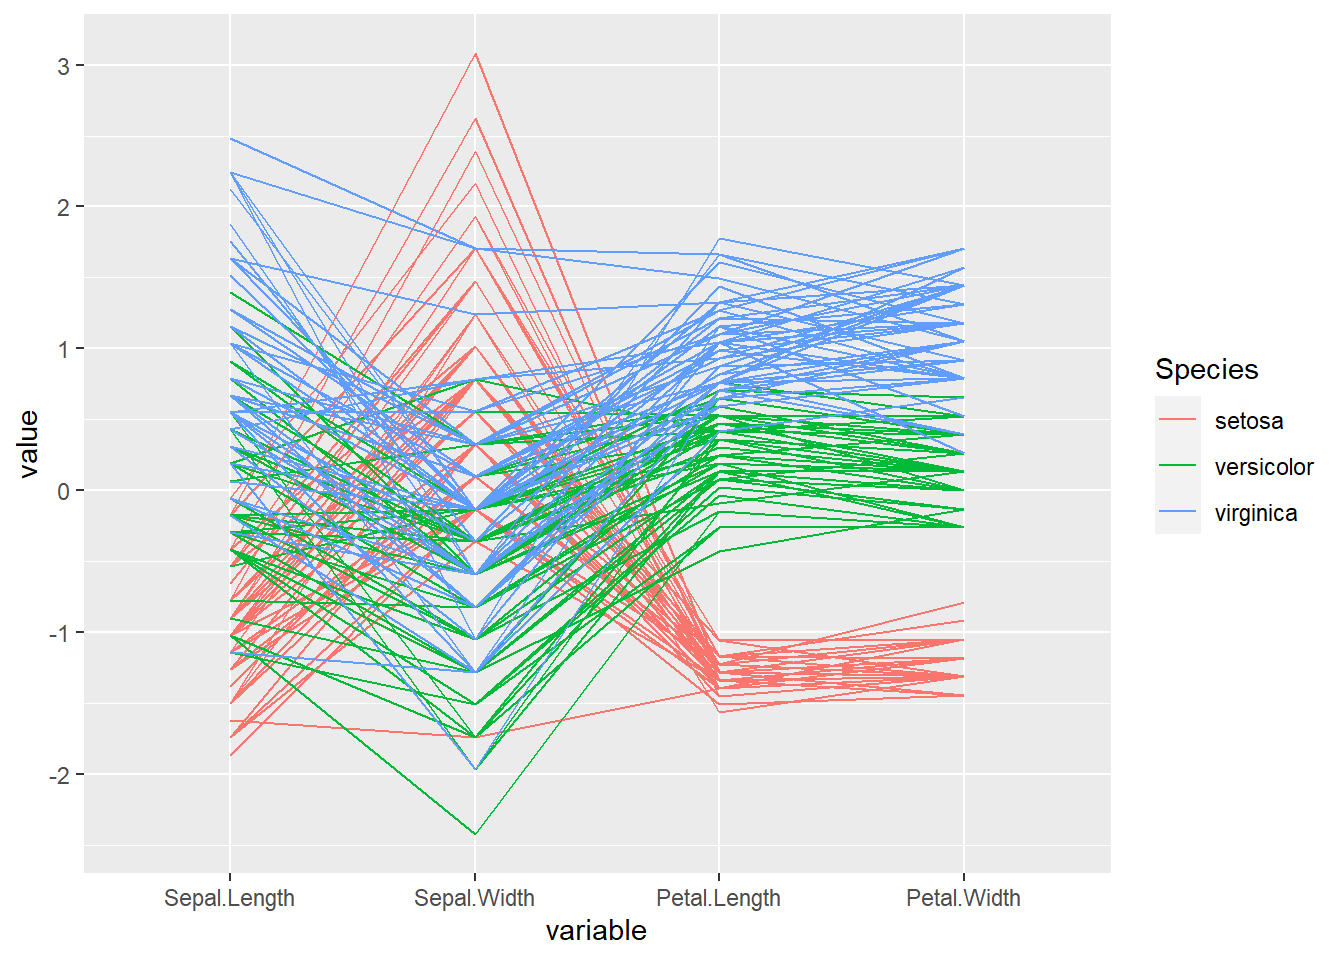
This is the most basic parallel coordinates chart you can build with R, the ggally packages and its ggparcoord() function.
The input dataset must be a data frame with several numeric variables, each being used as a vertical axis on the chart. Columns number of these variables are specified in the columns argument of the function.
Note: here, a categoric variable is used to color lines, as specified in the groupColumn variable.
# Libraries
library(GGally)

# Data set is provided by R natively
data <- iris

# Plot
ggparcoord(data,
    columns = 1:4, groupColumn = 5
)