Plots can be stratified by any variable in the dataframe like Age and Sex :
We will here use the swimmer_plot function in the Data & Function page and the stratify = option.
# Libraries
library(ggplot2)
library(swimplot)
#Stratifaction
swim_plot_stratify <-swimmer_plot(df=ClinicalTrial.Arm,id='id',start = 0, end='End_trt',name_fill='Arm',
col="black",alpha=0.75,width=.8,base_size = 14,stratify= c('Age','Sex')) +
theme(axis.text.y=element_blank(), # Not display id axis
axis.ticks.y=element_blank())
swim_plot_stratify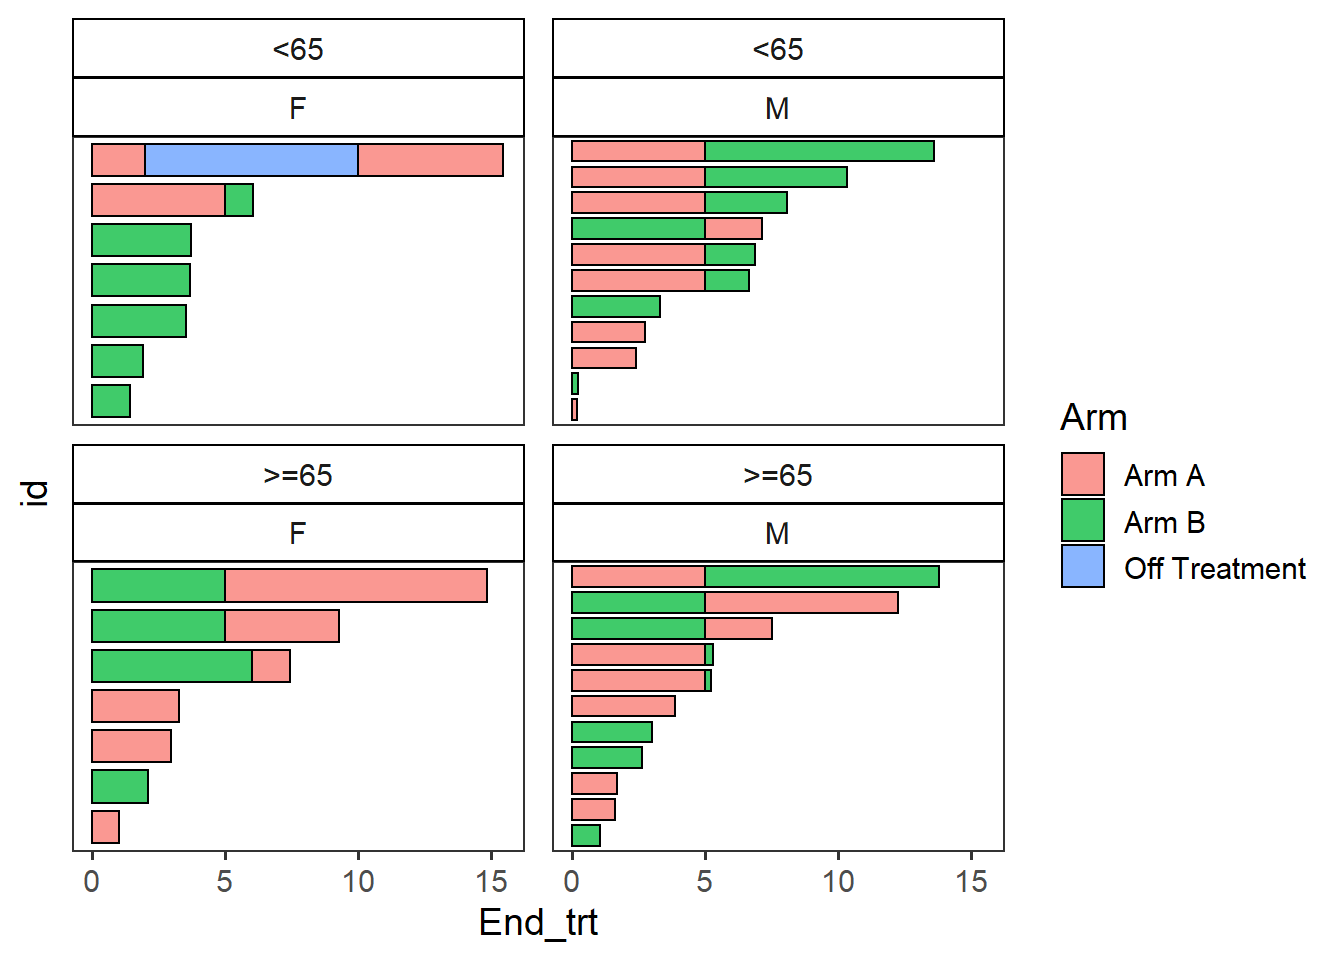
Contact
This document is a work by Emma Lafaurie (emma.lafaurie@inserm.fr) for the SBIM (Service de Biostatistique et Information Médicale) at Saint-Louis Hospital in Paris.
Based on the template of Yan Holtz.