To add information to the swimmer plot we can use the swimmer points function.
We will here use the swimmer_plot function in the Data & Function page and the swimmer_points() function.
Swimmer_points function
swimmer_points(
df_points, a data frame
id = "id", column name for id
time = "time", column name with the point locations
adj.y = 0, amount to adjust the point within the box vertically (default is 0, point is in the centre of each bar)
name_shape = NULL, a column name to map the point shape
name_col = NULL, a column name to map the point colour
name_size = NULL, a column name to map the point size
name_fill = NULL, a column name to map the point fill
name_stroke = NULL, a column name to map the
name_alpha = NULL, a column name to map the point transparency
...
)
# Libraries
library(ggplot2)
library(swimplot)
#Basic swimmer plot
arm_plot <- swimmer_plot(df=ClinicalTrial.Arm,id='id',start = 0, end='End_trt',name_fill='Arm',
id_order='Arm',col="black",alpha=0.75,width=.8) +
theme(axis.text.y=element_blank(), # Not display id axis
axis.ticks.y=element_blank())#Swimmer plot with points
arm_plot + swimmer_points(df_points=
ClinicalTrial.AE,id='id',time='time',name_shape =
'event',size=2.5,fill='white',name_col = 'Related')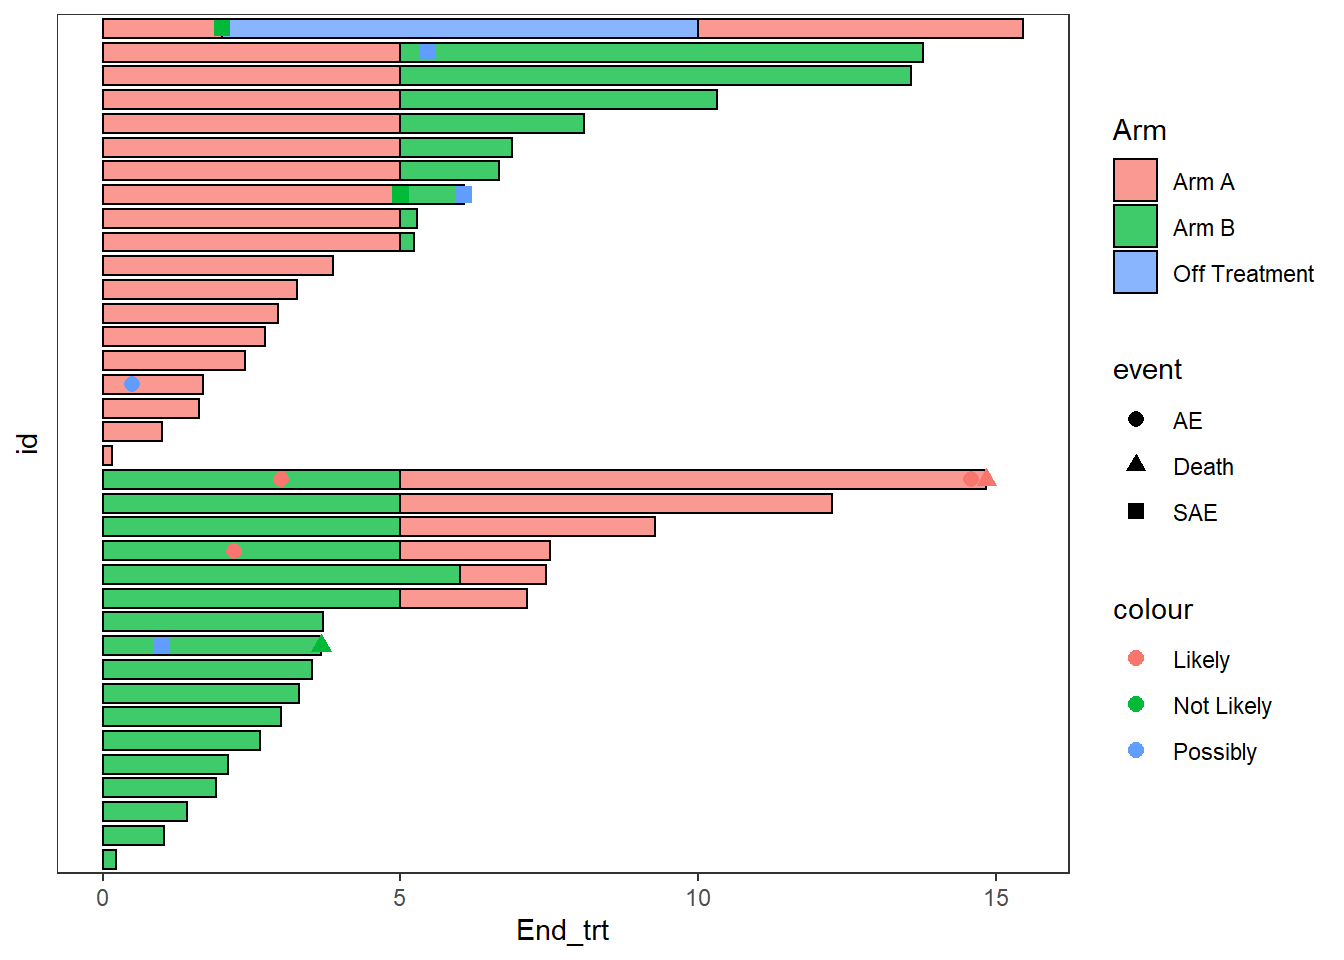
Contact
This document is a work by Emma Lafaurie (emma.lafaurie@inserm.fr) for the SBIM (Service de Biostatistique et Information Médicale) at Saint-Louis Hospital in Paris.
Based on the template of Yan Holtz.