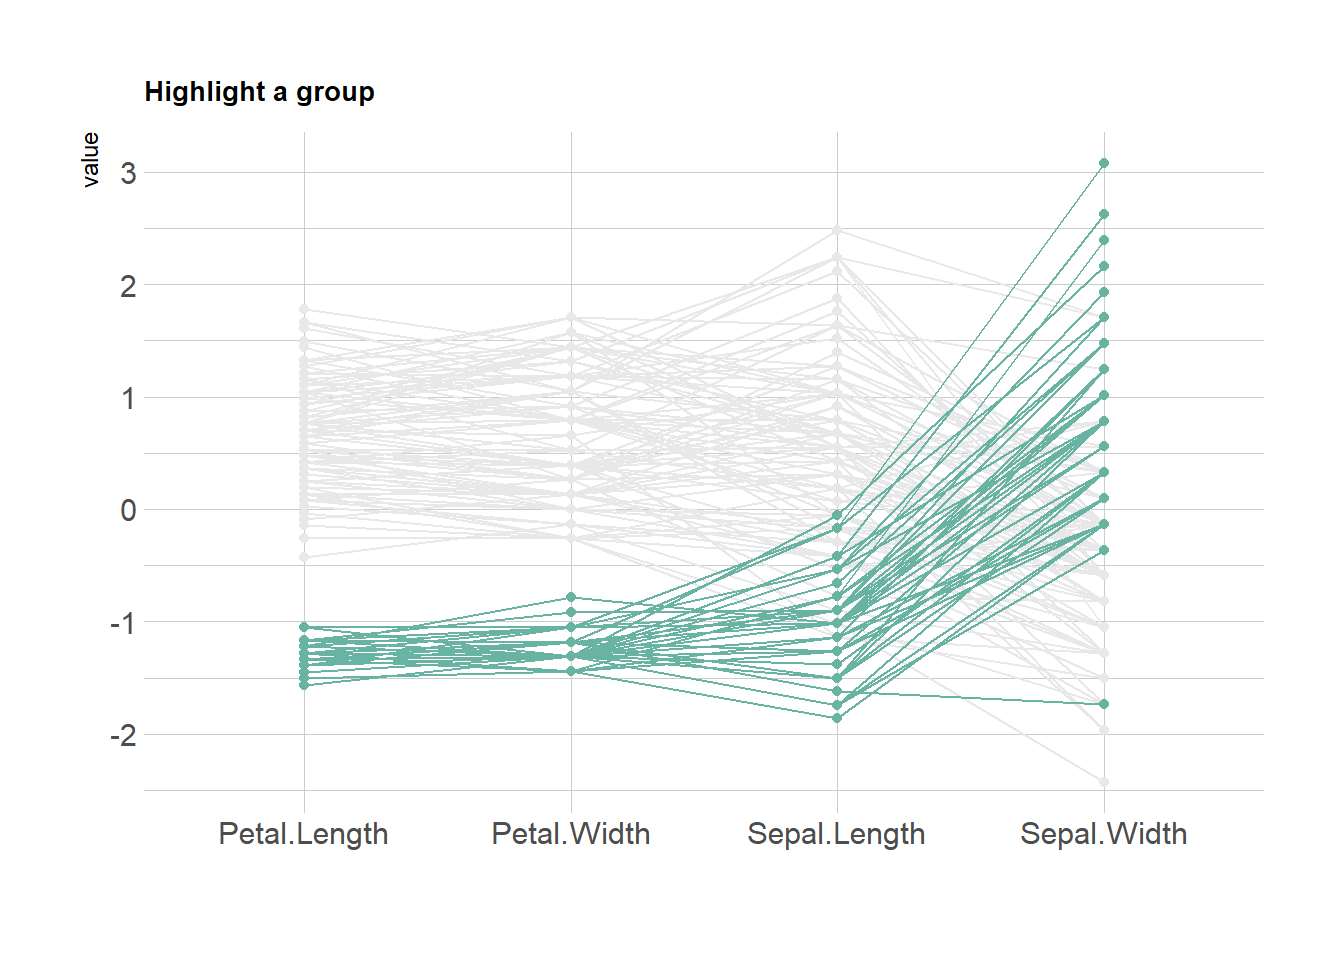
If you are interested in a specific group, you can highlight it as follow:
# Libraries
library(GGally)
library(dplyr)
library(hrbrthemes)

# Data set is provided by R natively
data <- iris

# Plot
data %>%
  arrange(desc(Species)) %>%
  ggparcoord(
    columns = 1:4, groupColumn = 5, order = "anyClass",
    showPoints = TRUE,
    title = "Highlight a group",
    alphaLines = 1
    ) +
  scale_color_manual(values=c( "#69b3a2", "#E8E8E8", "#E8E8E8") ) +
  theme_ipsum()+
  theme(
    legend.position="Default",
    plot.title = element_text(size=10)
  ) +
  xlab("")