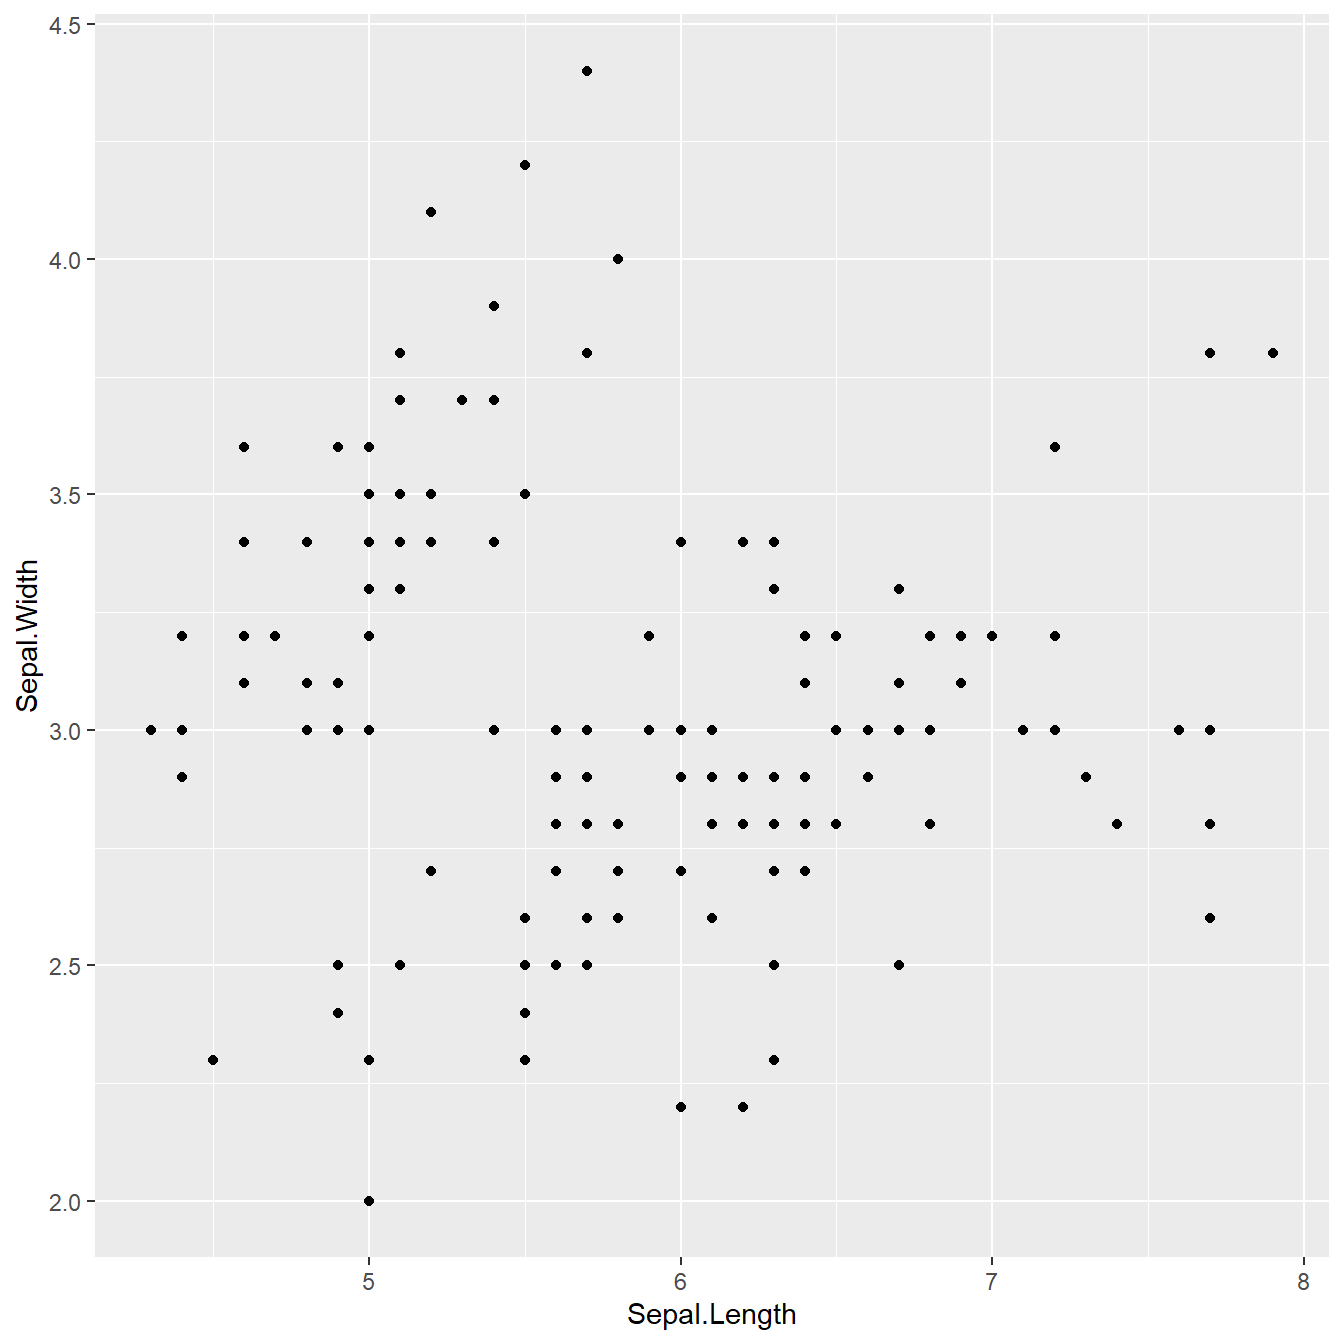
A scatterplot displays the values of two variables along two axes. It shows the relationship between them, eventually revealing a correlation.
Here the relationship between Sepal width and Sepal length of several plants is shown.
It illustrates the basic utilization of ggplot2 for scatterplots:
- 1 - provide a dataframe
- 2 - tell which variable to show on x and y axis
- 3 - add a
geom_point()to show points.
# library
library(ggplot2)

# The iris dataset is provided natively by R
#head(iris)

# basic scatterplot
ggplot(iris, aes(x=Sepal.Length, y=Sepal.Width)) +
    geom_point()