likert function
likert(
items, Data frame containing the likert based items. The variables in the data frame should be factors
summary, A pre-summarized data frame
grouping = NULL, Should the results be summarized by the given grouping variable (optional)
factors = NULL, A vector with length(factors) == ncol(items) defining which factor each column belongs to. The values correspond to the factor label.
importance = FALSE, Data frame of the same dimensions as items containing an importance rating for each item
nlevels = length(levels(items[, 1])), Number of possible levels. Only necessary if there are missing levels
)
Likert is an R package designed to help analyzing and visualizing Likert type items. It has been developped by Jason Bryer and Kim Speerschneider.
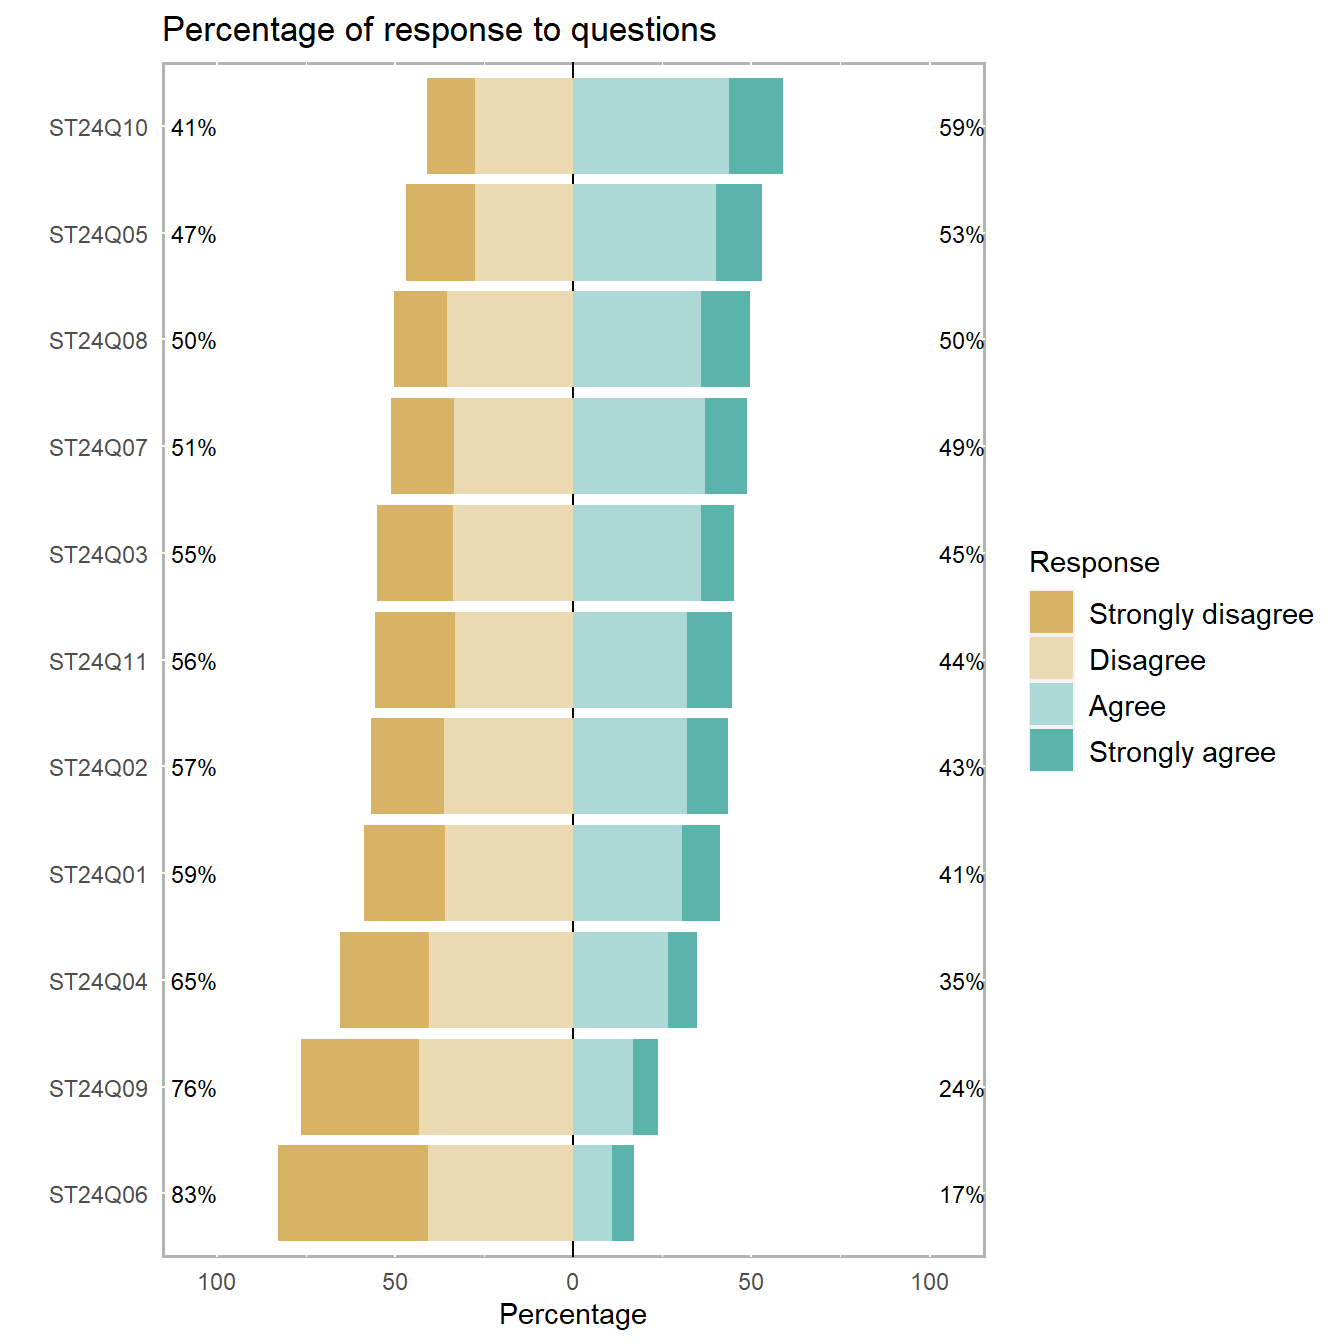
This barplot comes from the demo page.
It allows to analyse the reading attitudes from a panel of people. Each line represents a question. The barplot explains the feeling of people concerning this question.
# library
library(likert)

# Use a provided dataset
data(pisaitems)
items28 <- pisaitems[, substr(names(pisaitems), 1, 5) == "ST24Q"]

# Build plot
p <-likert(items28)
plot(p) +
  ggtitle("Percentage of response to questions") +
  theme(legend.text = element_text(size = rel(1)),
        legend.position = "right")