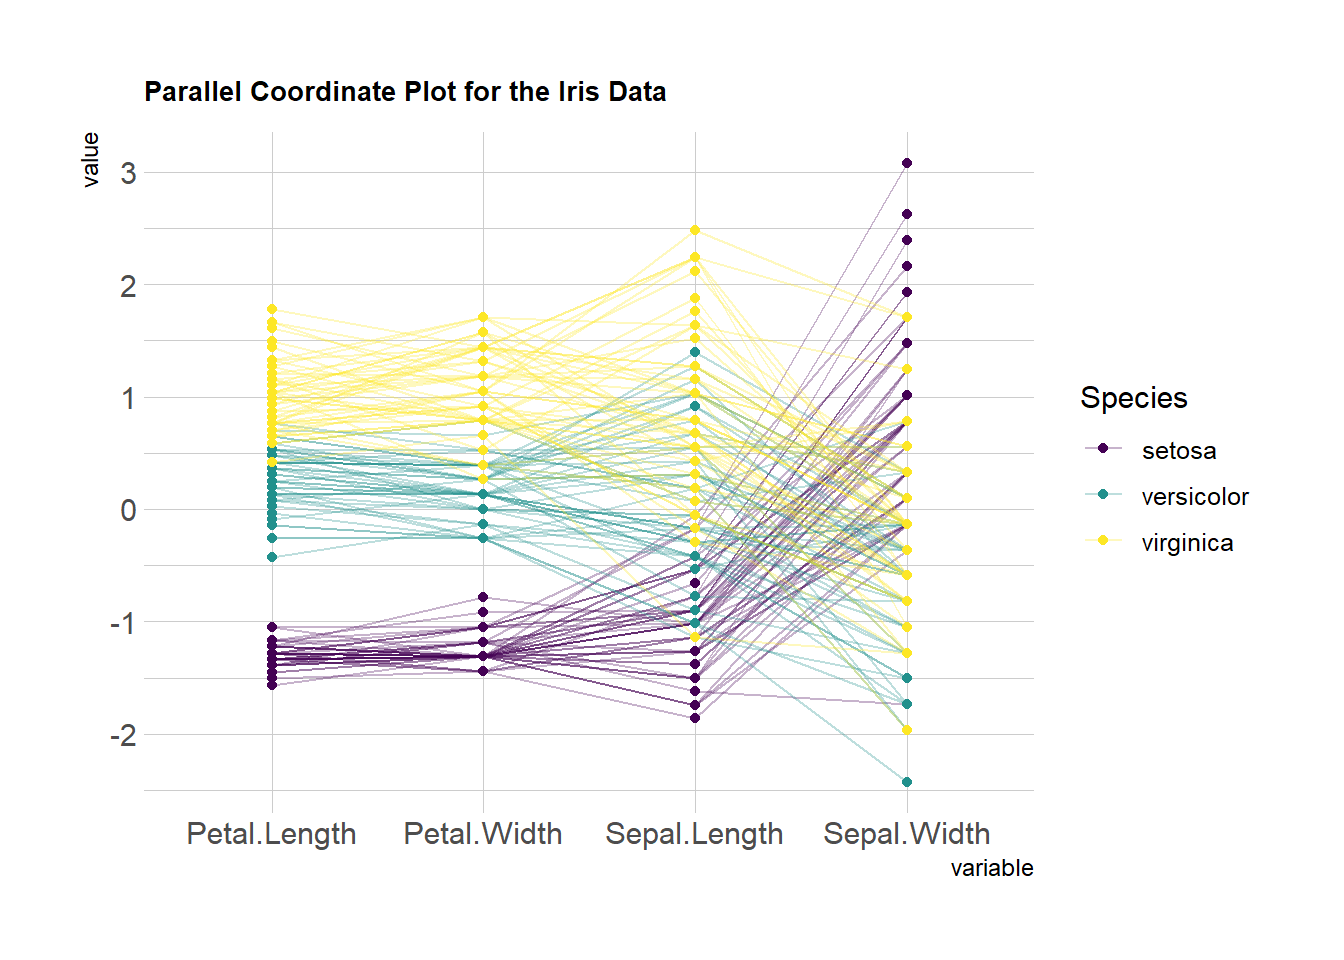
This is pretty much the same chart as the basic one, except for the following customizations:
- color palette is improved thanks to the
viridispackage - title is added with
title, and customized intheme - dots are added with
showPoints - a bit of transparency is applied to lines with
alphaLines theme_ipsum()is used for the general appearance
# Libraries
library(hrbrthemes)
library(GGally)
library(viridis)

# Data set is provided by R natively
data <- iris

# Plot
ggparcoord(data,
    columns = 1:4, groupColumn = 5, order = "anyClass",
    showPoints = TRUE,
    title = "Parallel Coordinate Plot for the Iris Data",
    alphaLines = 0.3
    ) +
  scale_color_viridis(discrete=TRUE) +
  theme_ipsum()+
  theme(
    plot.title = element_text(size=10)
  )