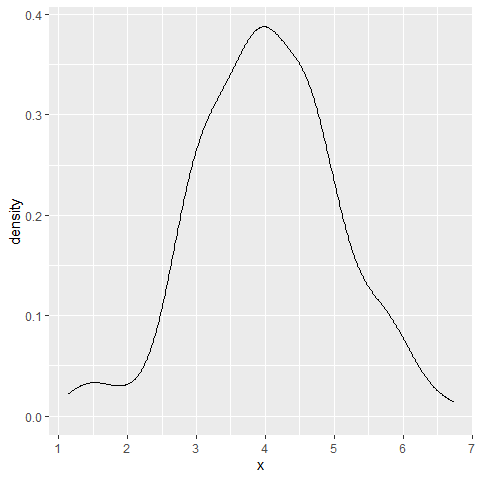
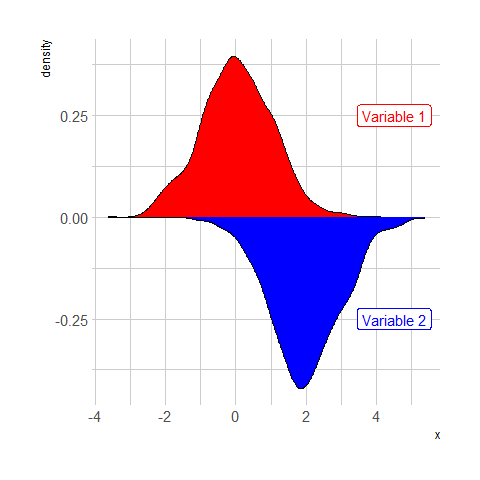
A density plot shows the distribution of numeric variable. In ggplot2, the geom_density() function takes care of the kernel density estimation and plot the results. Only one numeric variable is needed as input.
ggplot2
geom_density()
Most basic density curve
Basic line curve
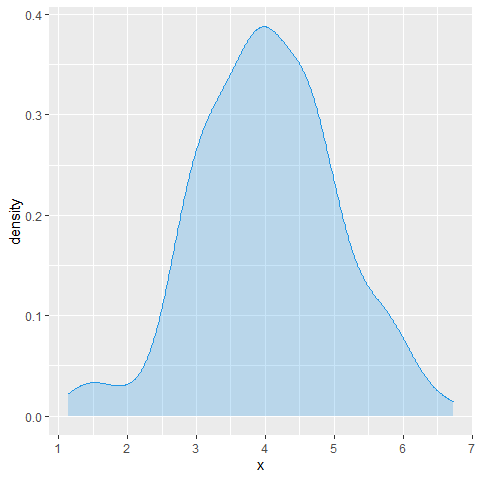
Colored density curve
Add color
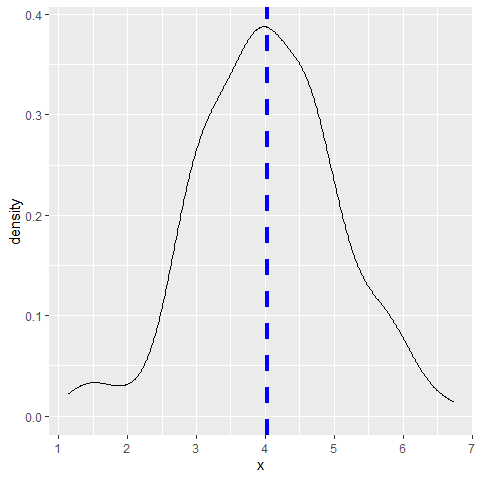
Mean line density curve
Add mean line
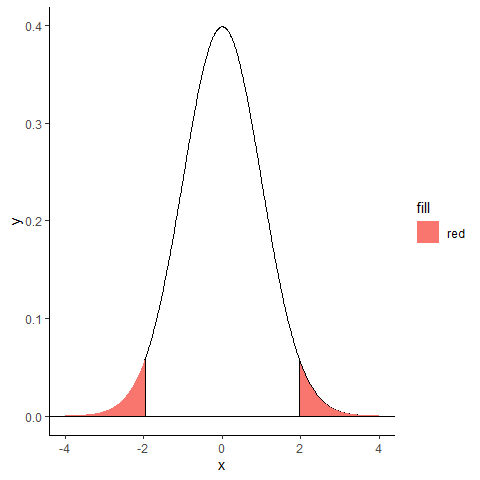
Density curve with filled area
Fill area with polygon() function
polygon()
Mirror density curve
Two density curves face to face to compare